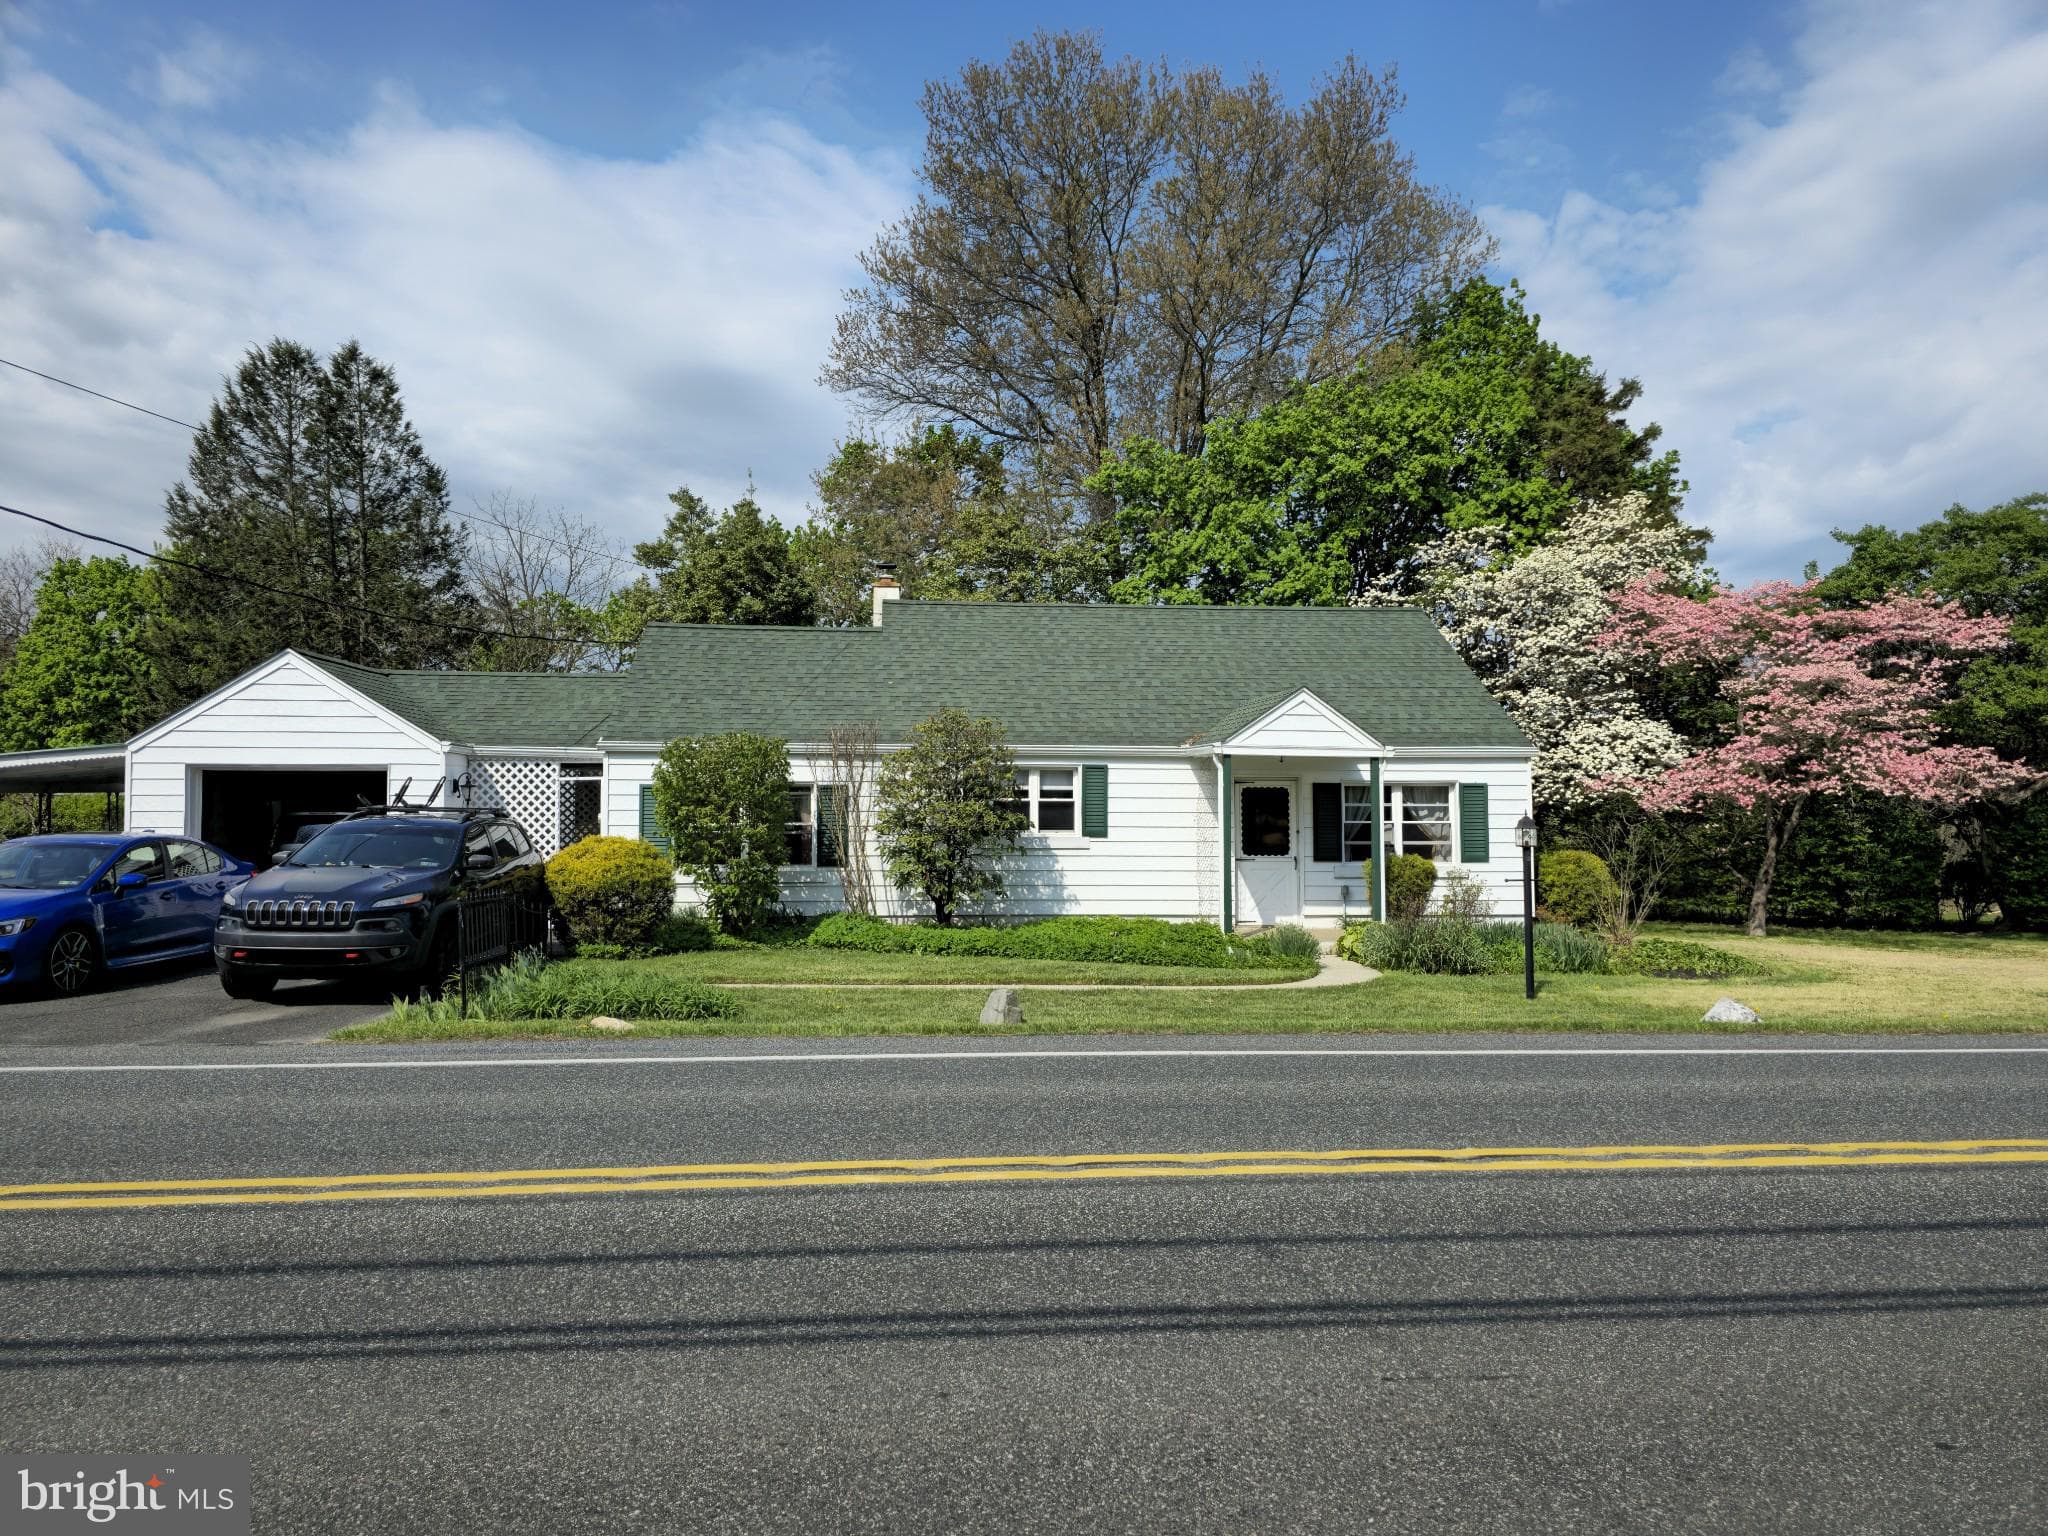
$434,900
3 bd|1.5 ba|1,344 sqft
21 Perkiomen Ave, Spring Mount, PA 19478
Listed by Real of Pennsylvania
Montgomery County + Berks County
% proficient or advanced, official PDE district files. Black tick = state average.
Berks County side: effective school tax ≈ 0.92% (billed on that county's assessments).
Rates assume an assessment at Montgomery County's current Common Level Ratio (29.80%). PA does not reassess on sale. Exact math for any price: the calculator.
Beyond test scores: official, public measures of student support and community context that families ask about. District- and county-level only; never a rating of an individual school, student, or home.
U.S. Dept. of Education / NCES, 2021-22. Gray figures are the PA average.
Special-education enrollment is the share of students receiving IEP or related services: the support a district provides, not a drawback. Counselor and psychologist ratios compare against ASCA (250:1) and NASP (500:1) recommendations.
Pennsylvania Department of Health. County-level, not specific to any school or district.
Down from 178 the prior year and a peak of 220 in 2020. Recent years are provisional.
Share of students present at least 90% of enrolled days, vs. 79.6% statewide. Enrollment-weighted across the district's schools. Pennsylvania Future Ready PA Index, 2024-25.
U.S. Dept. of Education, Office for Civil Rights — Civil Rights Data Collection (CRDC), 2021-22. Incidents per 1,000 enrolled students; one student can account for several incidents, so this is not the share of students involved. Figures are privacy-adjusted at the school level; small district counts are shown as “fewer than 10.”
Bullying counts are incidents a district formally reported under federal civil-rights categories, a widely underreported measure. A low number (including zero) often reflects reporting practices more than the absence of bullying.
These figures describe districts and counties, not individual schools, students, or homes. They are official public data and may be self-reported, lag by a year or more, or be underreported. They are context for families, not a safety rating. Sources: U.S. Department of Education, NCES Common Core of Data (2021-22); Pennsylvania Department of Health; Pennsylvania Future Ready PA Index (2024-25); U.S. Dept. of Education, Office for Civil Rights — Civil Rights Data Collection (CRDC) (2021-22).
5 public schools. Open any for grades, enrollment, and attendance.
| Municipality | Muni millage | Total millage | Effective rate | Tax on $450,000 |
|---|---|---|---|---|
| Upper Hanover Township | 1.45 mills | 36.21 mills | 1.08% | ≈ $4,856/yr |
| Marlborough Township | 3.37 mills | 38.13 mills | 1.14% | ≈ $5,113/yr |
| Green Lane Borough | 3.5 mills | 38.26 mills | 1.14% | ≈ $5,131/yr |
| Red Hill Borough | 4.2 mills | 38.96 mills | 1.16% | ≈ $5,225/yr |
| East Greenville Borough | 7.4 mills | 42.16 mills | 1.26% | ≈ $5,654/yr |
| Pennsburg Borough | 9.725 mills | 44.49 mills | 1.33% | ≈ $5,965/yr |
Active listings across the district's towns. Every home here feeds the same schools.
$434,900
21 Perkiomen Ave, Spring Mount, PA 19478
Listed by Real of Pennsylvania
$185,000
162 Dale Rd, Barto, PA 19504
Listed by Keller Williams Platinum Realty - Wyomissing
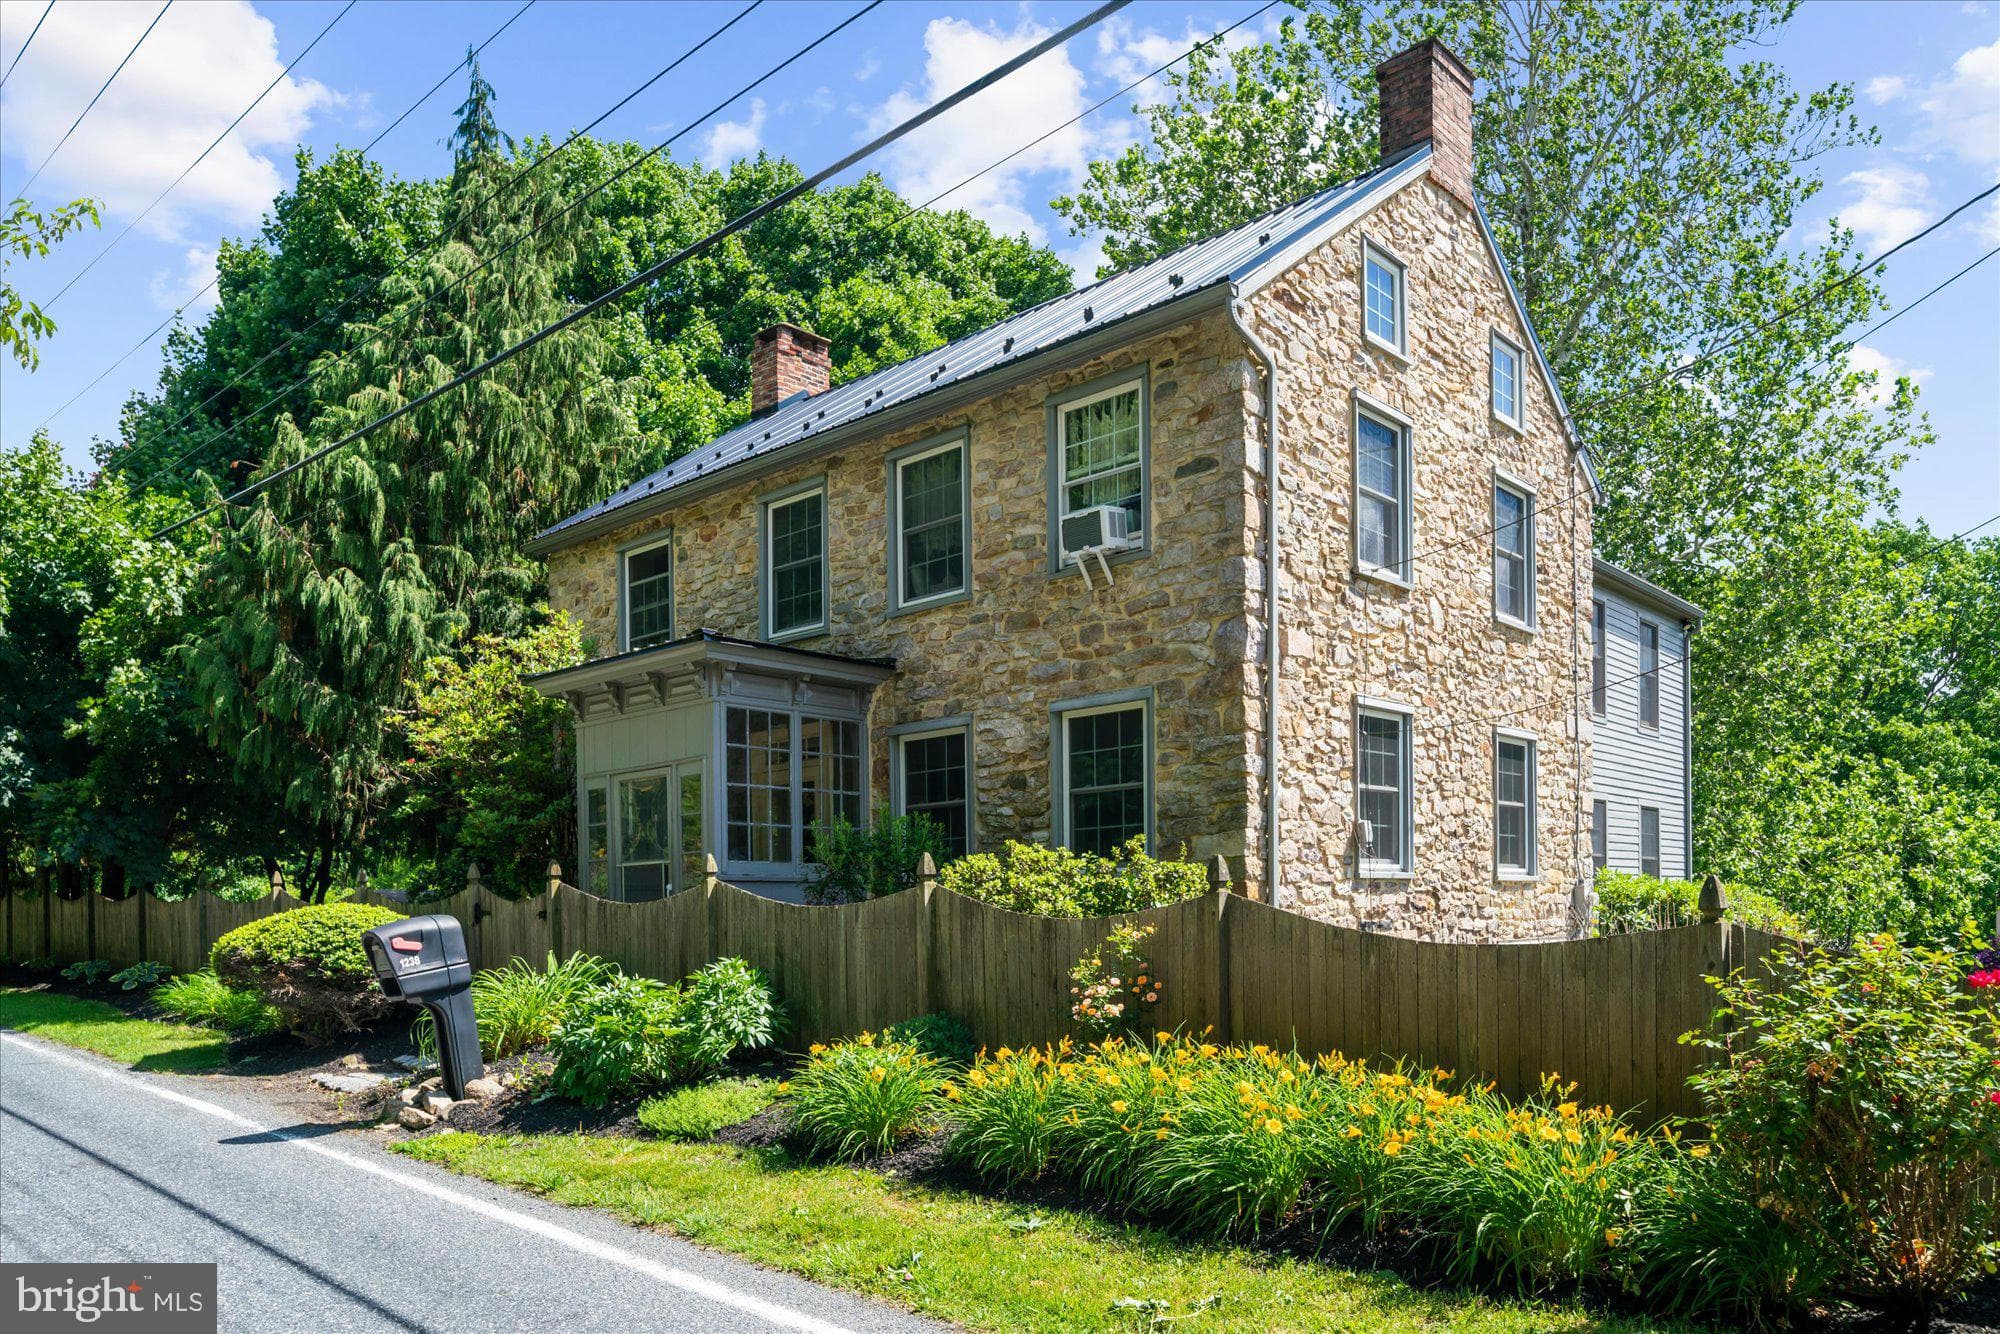
$899,700
1238 Huffs Church Rd, Barto, PA 19504
Listed by Herb Real Estate, Inc.
$599,900
46 Spring Hill Rd, Hereford, PA 18056
Listed by Century 21 Longacre Realty
$432,000
Price cut: $48,000 (Jul 24)
10 Ryanford Rd, Schwenksville, PA 19473
Listed by Springer Realty Group
$72,900
Price cut: $4,600 (Jun 24)
74 Southwick Dr, Hereford, PA 18056
Listed by Century 21 Gold
$324,900
993 Gravel Pike, Palm, PA 18070
Listed by RE/MAX 440 - Pennsburg
$78,000
33 Squaw Cir, Barto, PA 19504
Listed by Keller Williams Realty Group
$55,000
254 Liberty Cir, Hereford, PA 18056
Listed by The Barndt Agency Inc
$344,900
Price cut: $10,000 (Jul 7)
975 Gravel Pike, Palm, PA 18070
Listed by Brode & Brooks Inc
$950,000
142 Township Rd, Macungie, PA 18062
Listed by RE/MAX 440 - Pennsburg
Upper Perkiomen scores 67.5 of 100 on the NookLocal Academic Index, #44 of 112 districts serving Bucks, Chester, Delaware, Montgomery, Berks, Lancaster, and the Lehigh Valley. Components (official 2025 PDE data): PSSA proficiency 56% (state ~45%), Keystone proficiency 66%, graduation rate 92.8% (state 89.1%). The index measures outcomes, not school effectiveness in isolation.
The district levies 28.8081 mills (2025-26) on Montgomery County's assessment base, an effective school tax of about 0.86% of market value at the current Common Level Ratio. With county and typical municipal millage, the total runs about 1.15%, roughly $5,178 per year on a $450,000 purchase. Exact bills vary by municipality (1.08%–1.33% across 6) and by the home's actual assessment.
Academically: Upper Perkiomen 67.5 vs. Hatboro-Horsham 67.7 on the Academic Index. On taxes: 1.15% vs. 1.46% of home value per year, about $5,178 vs. $6,550 on a $450,000 purchase. Full comparison on the school district value matrix.
86.3% of Upper Perkiomen students are regularly present (enrolled and attending at least 90% of school days) versus 79.6% statewide (Future Ready PA Index, 2024-25).
17.5% of students receive special-education services (Pennsylvania average 20.3%), with about 293 students per school counselor and 806 per school psychologist. The Family & student support section above has the full breakdown.
Rather than a single safety score, NookLocal shows official district figures. Regular attendance is 86.3% (state 79.6%). For 2021-22, the federal Civil Rights Data Collection reports about 37.2 out-of-school suspensions and 14.6 law-enforcement referrals per 1,000 students. These figures describe the district, not individual schools, and reported bullying is widely undercounted. See the Family & student support section.
Free email digest
School budgets and the state's Common Level Ratio reset every district's true rate each year. We send the re-rank when it changes, plus weekly new listings and price cuts.
Double opt-in. We only email you after you confirm. Unsubscribe any time. See our Privacy Policy.
Academic data: PA Department of Education district-level files (2024-25). Tax data: county assessment offices and STEB. Estimates only. Verify with the district and county before transacting. Full methodology on the value matrix.
Why NookLocal
NookLocal has the same homes you'll find on Zillow, Trulia, or Realtor.com, plus the local context they leave out: school district rankings, the full property-tax bill at today's rates, and sourced safety data.
A 1-on-1 needs analysis with our co-founder Carmen, then a local agent or lender picked for you. Partners who underdeliver stop getting referrals. If you work with a partner we introduce, NookLocal may earn a referral fee from their broker.
Get matchedMost families pick the district before the house. We score every district on academics against its tax cost, so you can find the best value, then search every home inside the boundary.
Search by districtPennsylvania taxes swing hard from town to town. We show each town's millage, the Common Level Ratio, and a calculator, so you know the yearly bill before you make an offer.
Try the calculatorThe big portals dropped their crime maps years ago. We publish sourced county figures from public FBI and Pennsylvania data, with their limits named.
See the dataNot a single 1 to 10 score. Explore 450+ individual school pages and a district value report that scores academics against what each town costs.
See the rankingsWe cover nine Pennsylvania counties: Greater Philadelphia, the Lehigh Valley, Berks, and Lancaster, built by people who live here.
Explore the areas