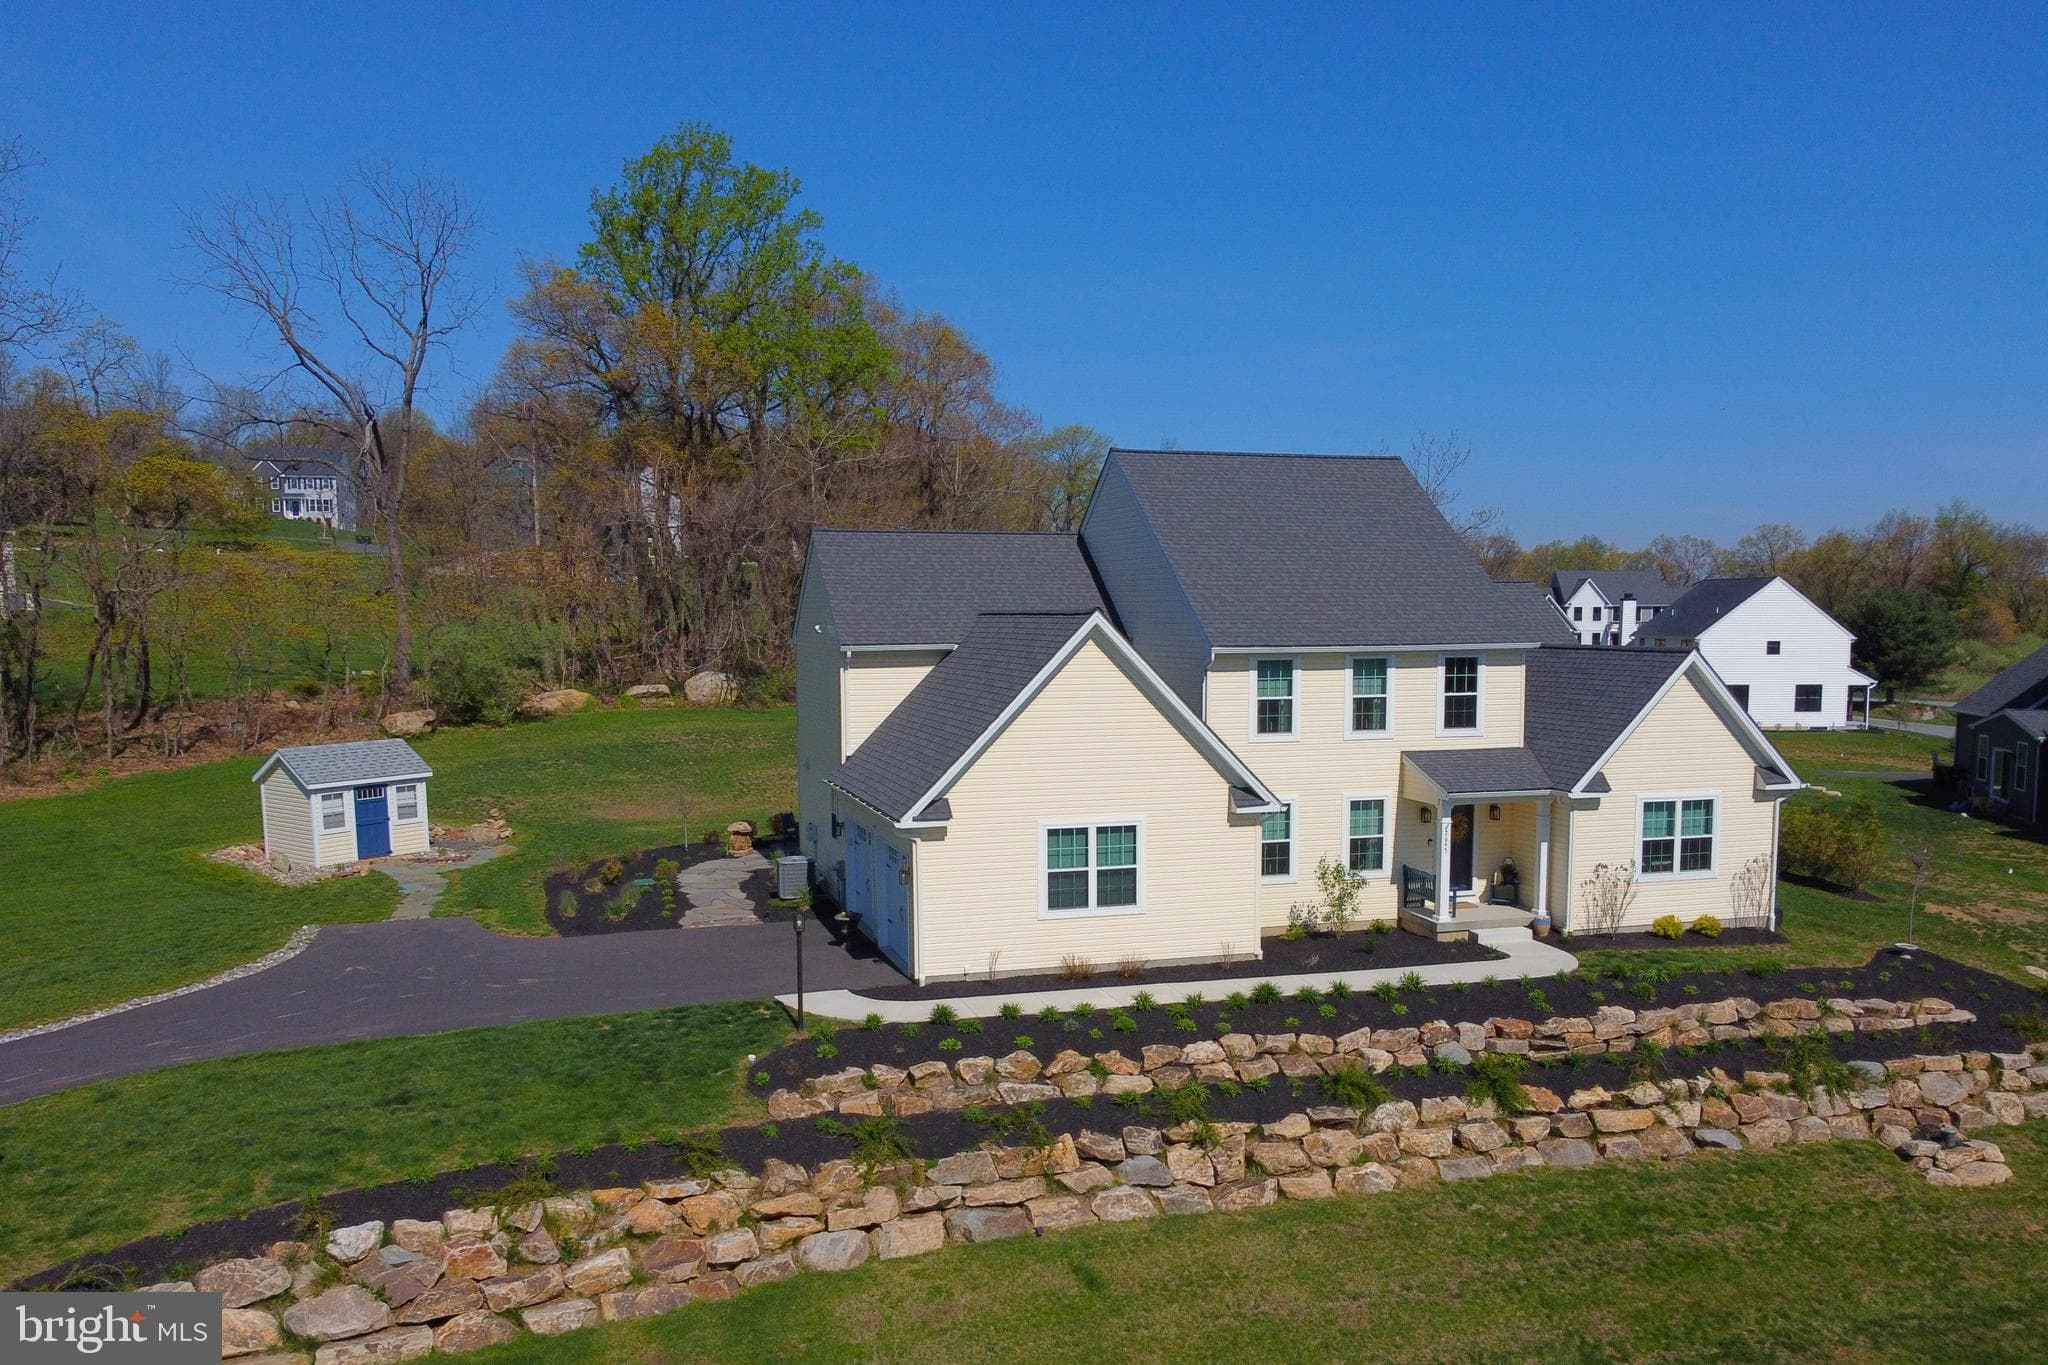
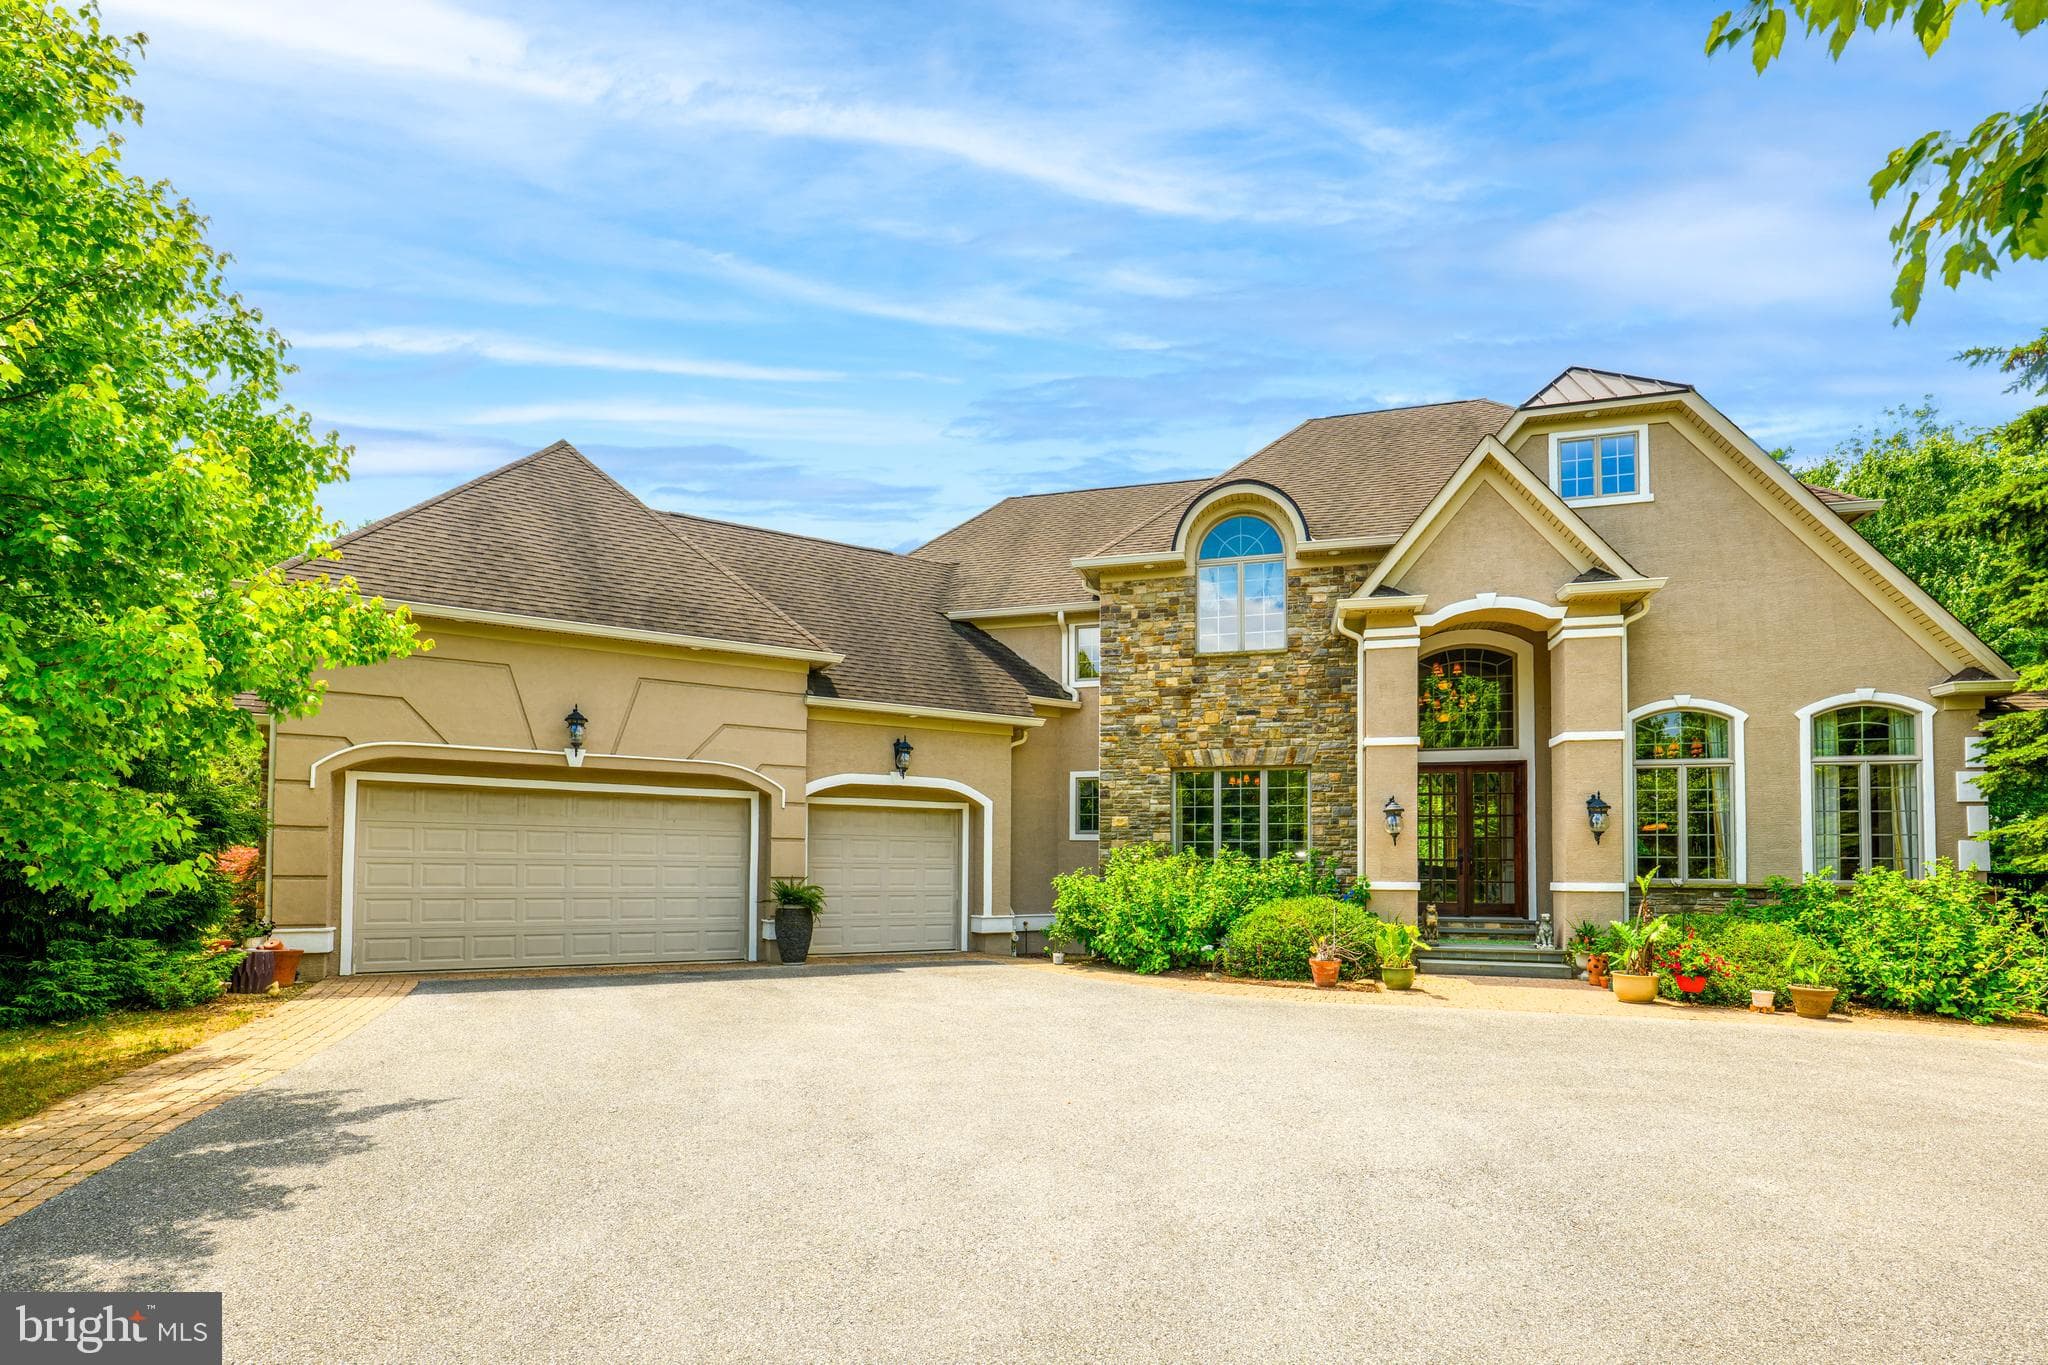
$900,000
4 bd|2.5 ba|3,090 sqft
2645 Longridge Dr, Hellertown, PA 18055
Listed by Realty Outfitters
Northampton County
% proficient or advanced, official PDE district files. Marigold tick = state average.
Rates assume an assessment at Northampton County's current Common Level Ratio (17.01%). PA does not reassess on sale. Exact math for any price: the calculator.
Beyond test scores — official, public measures of student support and community context that families ask about. District- and county-level only; never a rating of an individual school, student, or home.
U.S. Dept. of Education / NCES, 2020-21. Marigold figures are the PA average.
Special-education enrollment is the share of students receiving IEP or related services — the support a district provides, not a drawback. Counselor and psychologist ratios compare against ASCA (250:1) and NASP (500:1) recommendations.
Pennsylvania Department of Health. County-level — not specific to any school or district.
Down from 61 the prior year and a peak of 93 in 2017. Recent years are provisional.
Share of students present at least 90% of enrolled days, vs. 79.6% statewide. Enrollment-weighted across the district's schools. Pennsylvania Future Ready PA Index, 2024-25.
U.S. Dept. of Education, Office for Civil Rights — Civil Rights Data Collection (CRDC), 2021-22. Rate per 1,000 students. Figures are privacy-adjusted at the school level; small district counts are shown as “fewer than 10.”
Bullying counts are incidents a district formally reported under federal civil-rights categories — a widely underreported measure. A low number often reflects reporting practices more than the absence of bullying.
These figures describe districts and counties, not individual schools, students, or homes. They are official public data and may be self-reported, lag by a year or more, or be underreported — they are context for families, not a safety rating. Sources: U.S. Department of Education, NCES Common Core of Data (2020-21); Pennsylvania Department of Health; Pennsylvania Future Ready PA Index (2024-25); U.S. Dept. of Education, Office for Civil Rights — Civil Rights Data Collection (CRDC) (2021-22).
3 public schools — open any for grades, enrollment, and attendance.
| Municipality | Muni millage | Total millage | Effective rate | Tax on $450,000 |
|---|---|---|---|---|
| Lower Saucon Township | 5.74 mills | 71.75 mills | 1.22% | ≈ $5,492/yr |
| Hellertown Borough | 23 mills | 89.01 mills | 1.51% | ≈ $6,813/yr |
Active listings across the district's towns — every home here feeds the same schools.
$900,000
2645 Longridge Dr, Hellertown, PA 18055
Listed by Realty Outfitters
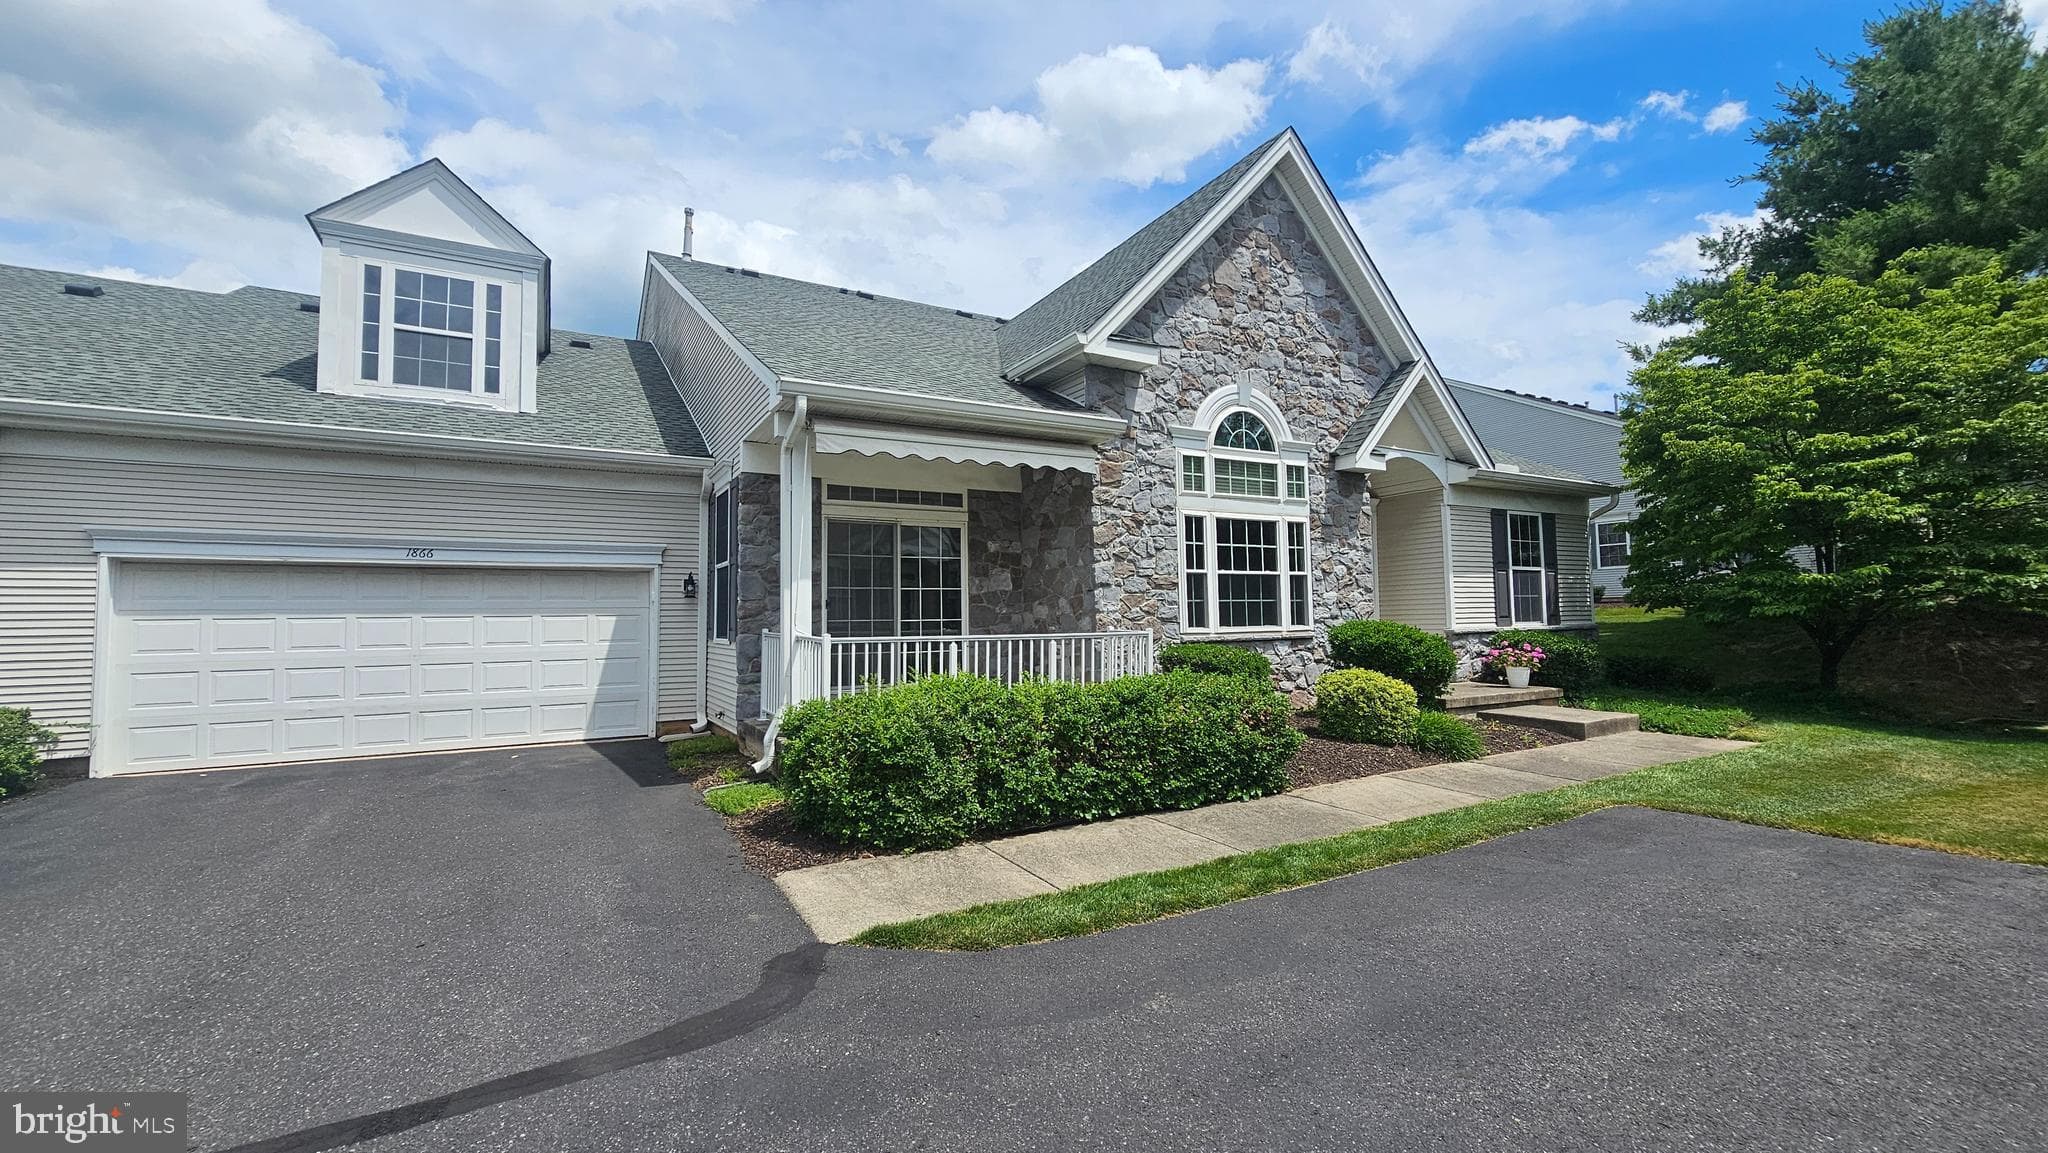
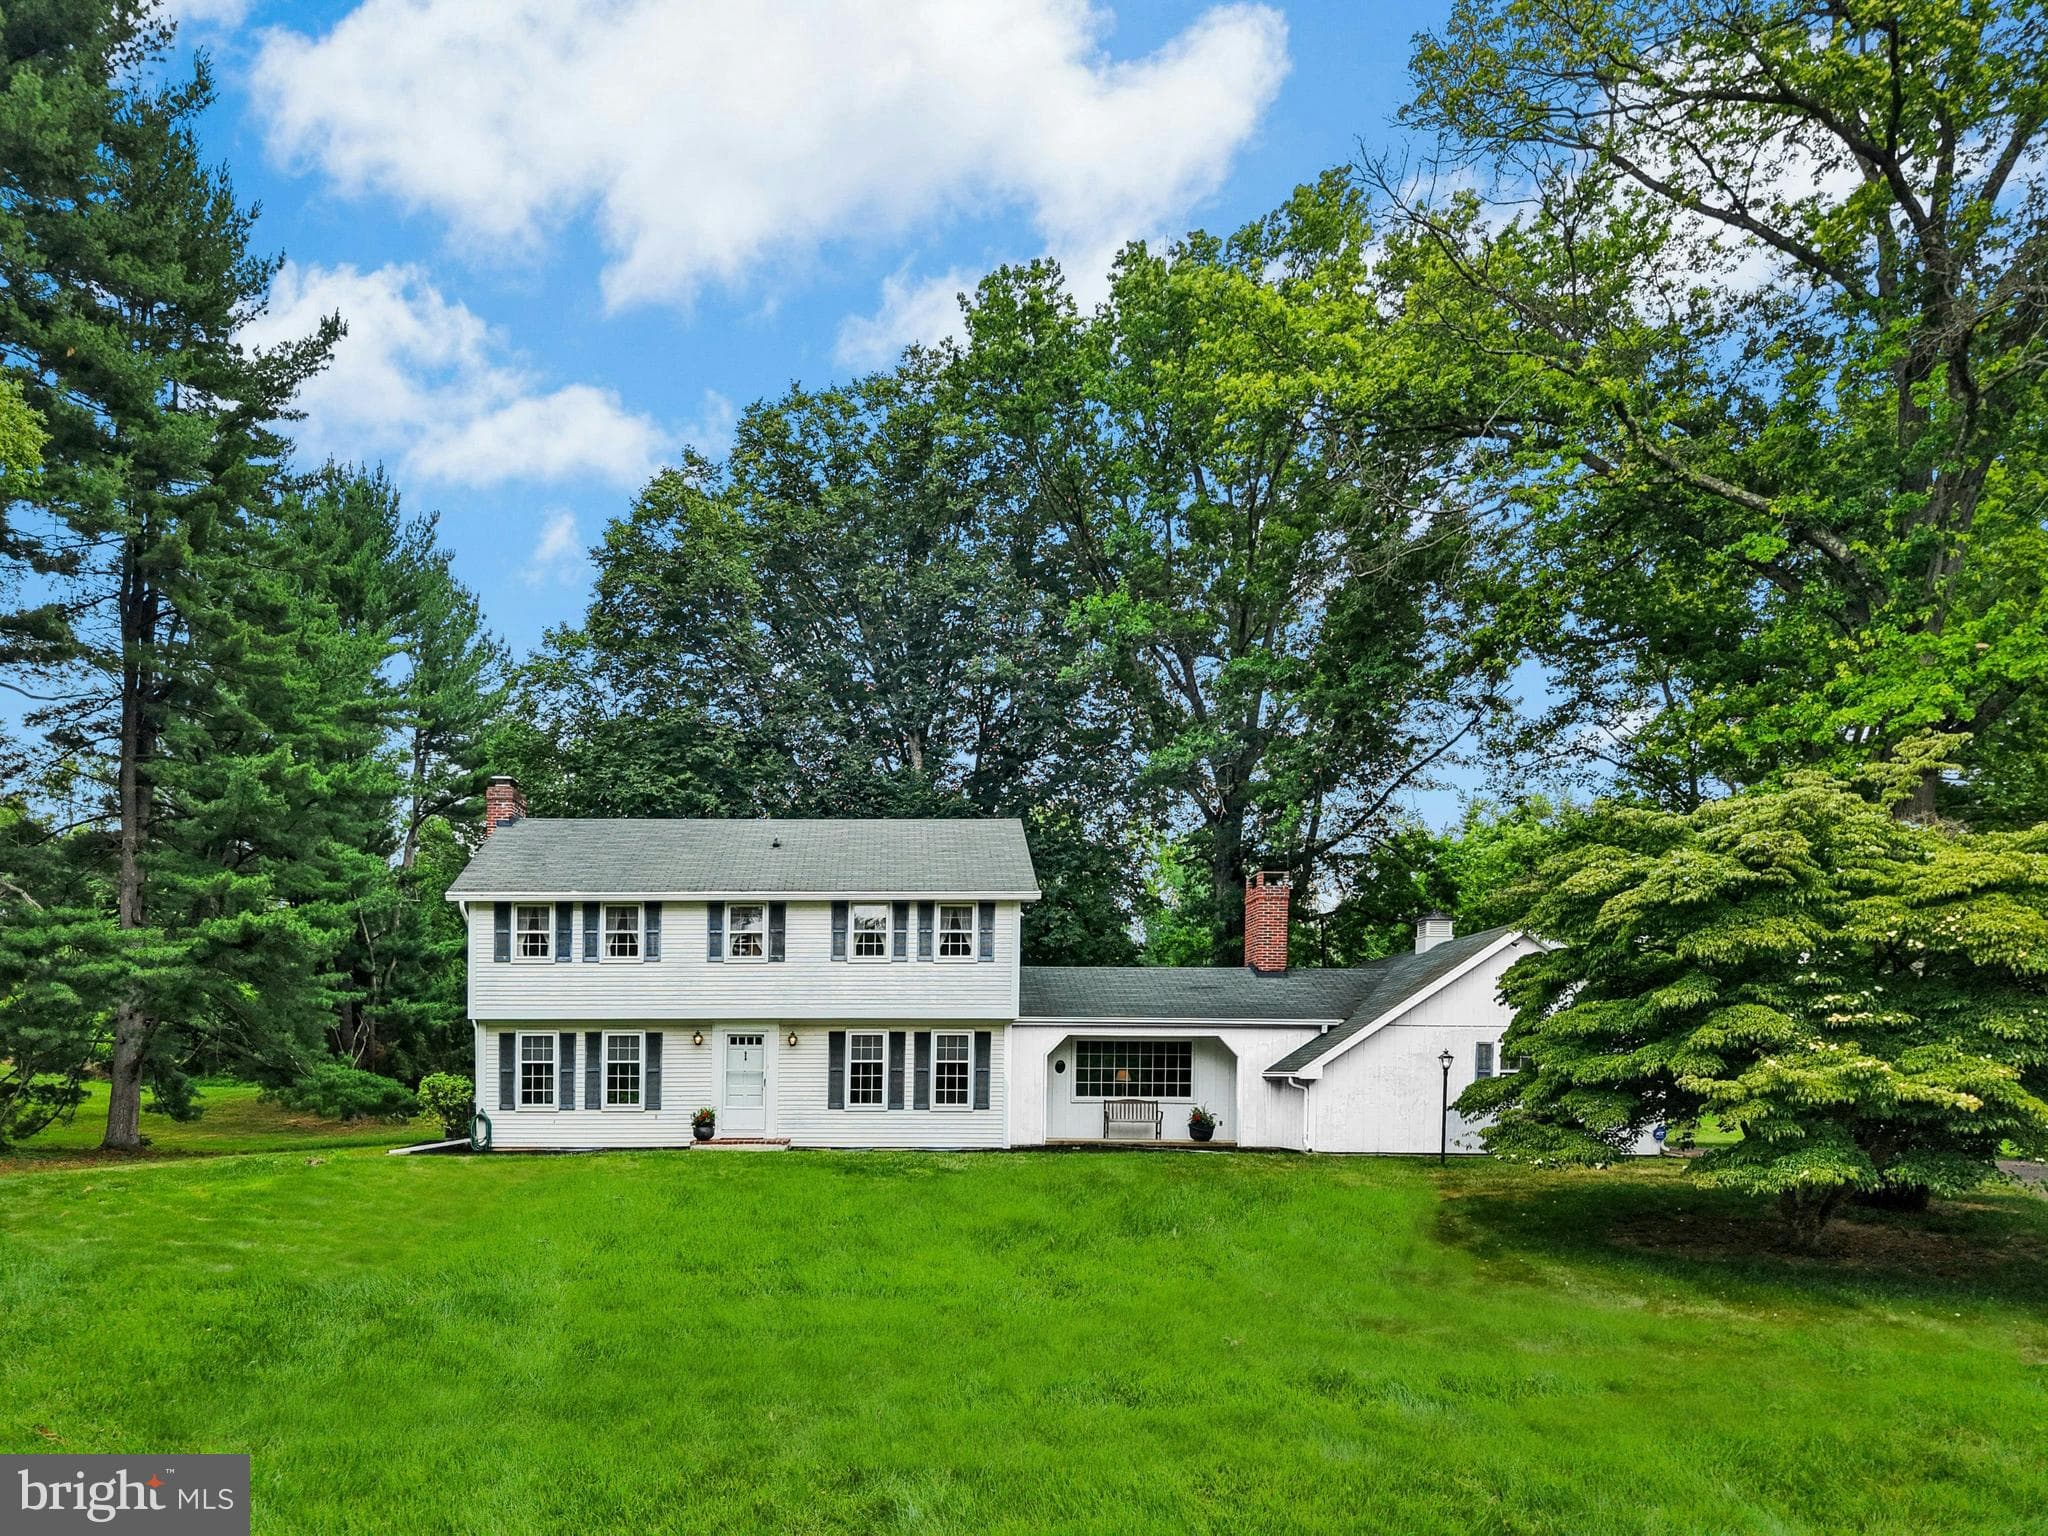
$445,000
1866 Gregory Pl, Hellertown, PA 18055
Listed by Realty Outfitters

$950,000
2760 Valley View Rd, Hellertown, PA 18055
Listed by EXP Realty, LLC
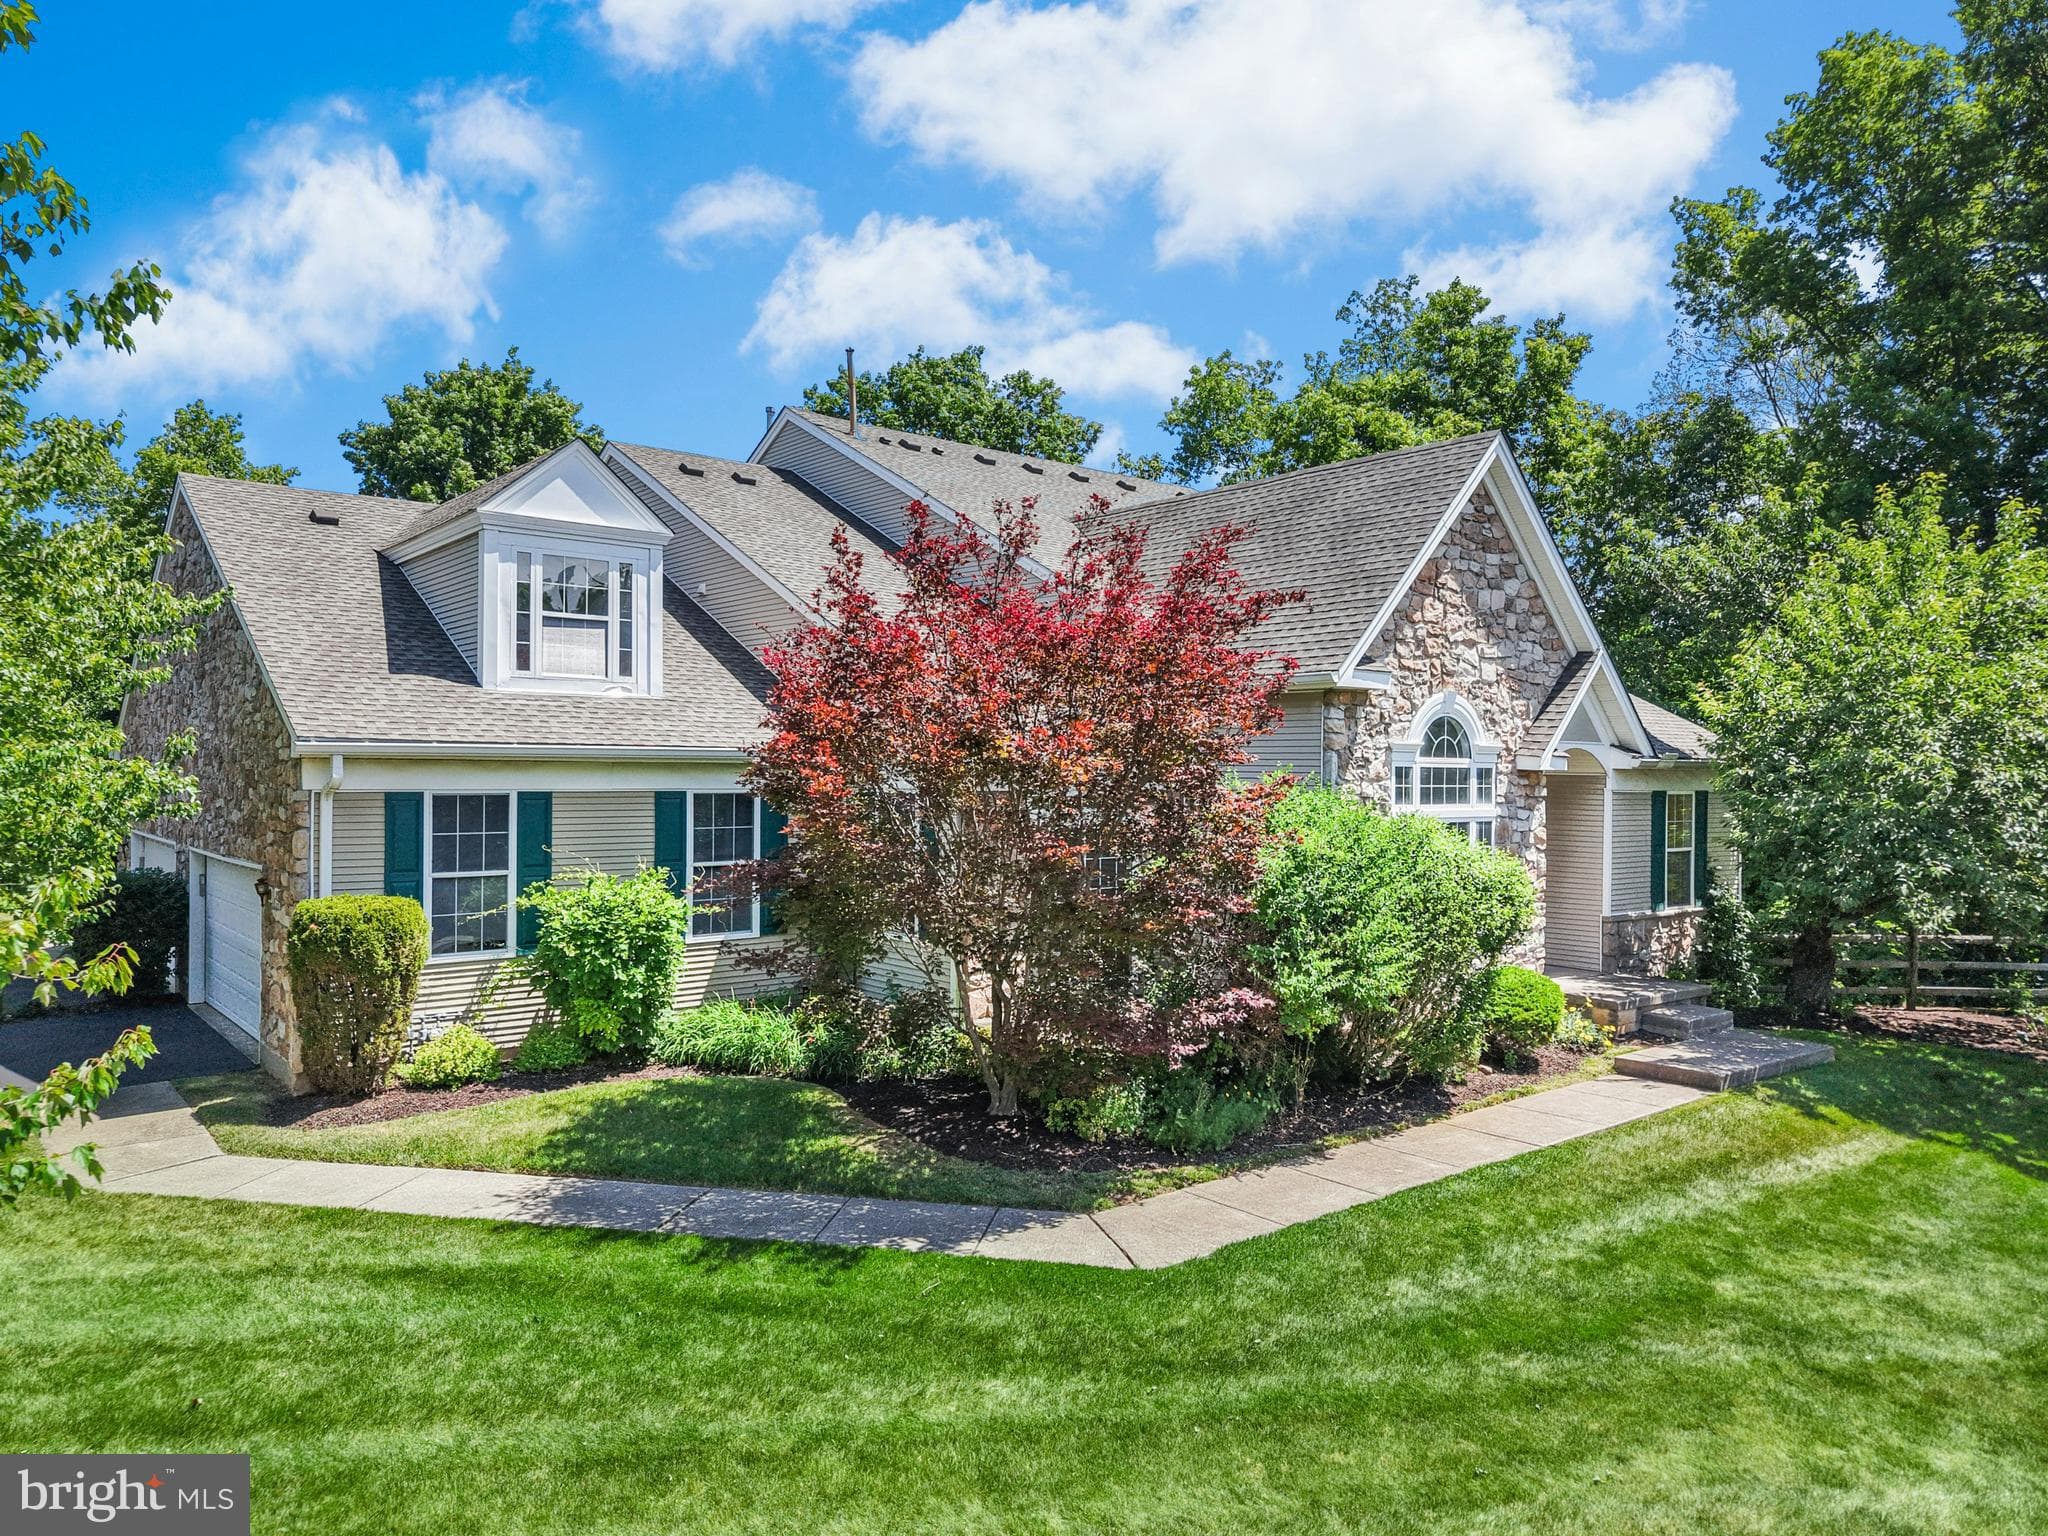
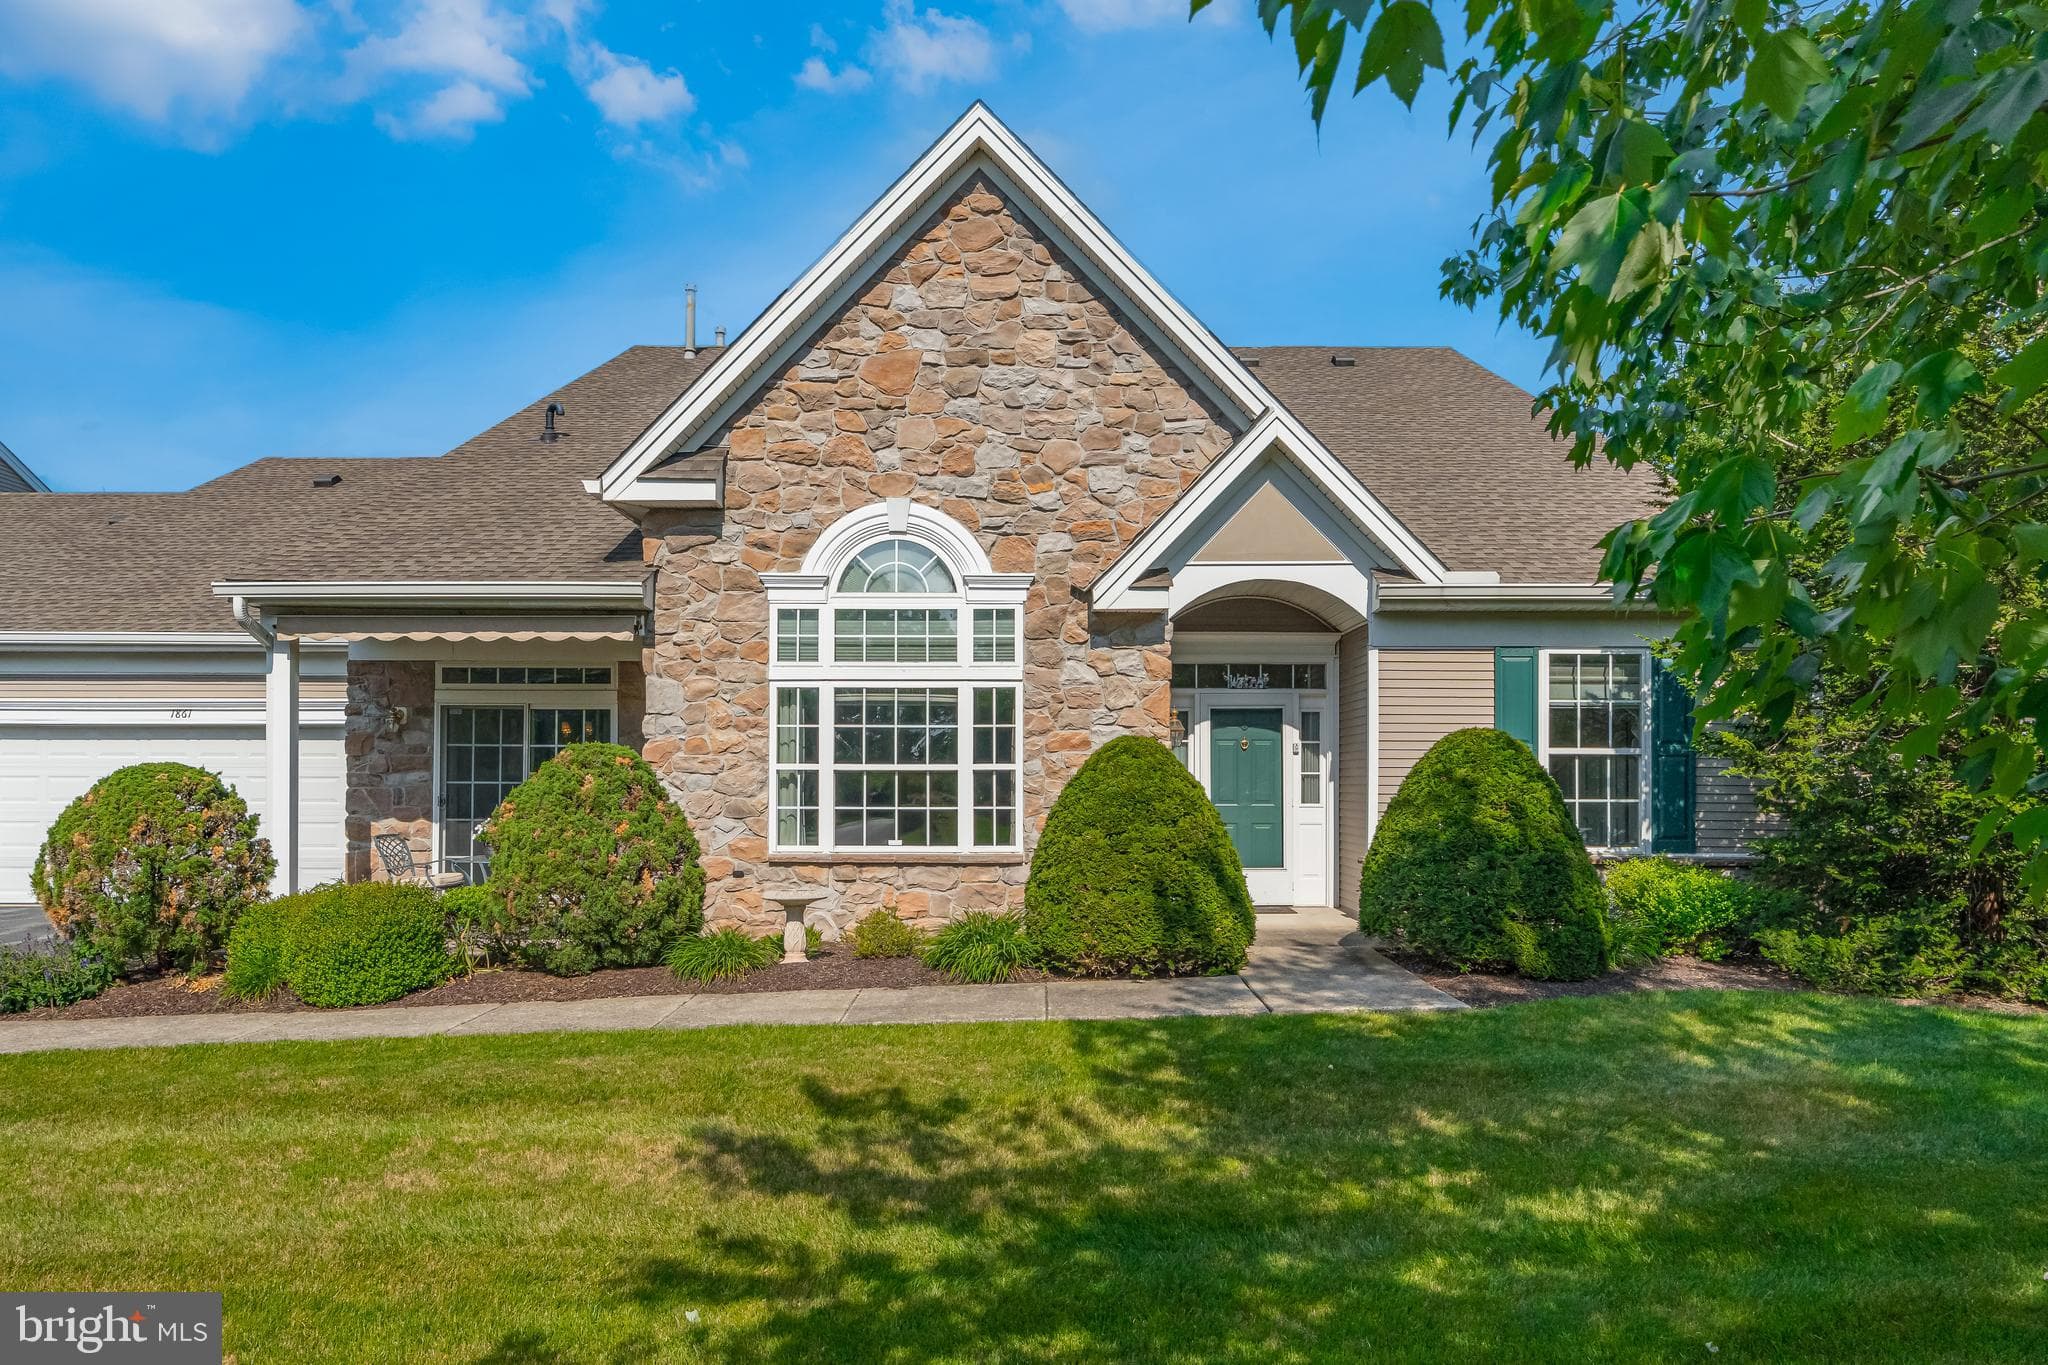
$545,000
1871 Caryn Dr, Hellertown, PA 18055
Listed by Carol C Dorey Real Estate
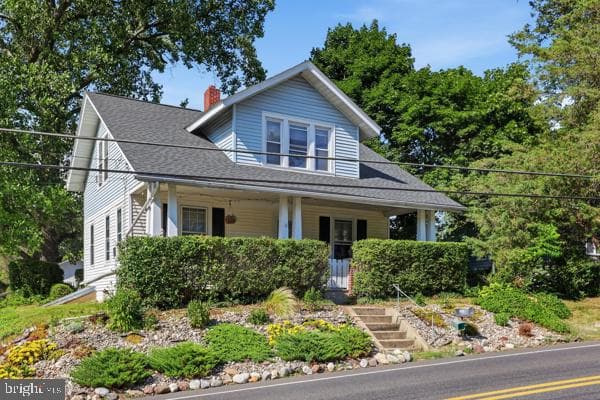
$340,000
2021 Leithsville Rd, Hellertown, PA 18055
Listed by Keller Williams Real Estate - Allentown

$950,000
1867 Old Mill Rd, Bethlehem, PA 18015
Listed by Carol C Dorey Real Estate
$999,900
Price cut: was $1,150,000
2690 Imperial Crest Ln, Hellertown, PA 18055
Listed by RE/MAX Unlimited Real Estate
$1,395,000
1501 Colesville Rd, Bethlehem, PA 18015
Listed by Carol C Dorey Real Estate
$395,000
1861 Felicity Ln, Hellertown, PA 18055
Listed by Keller Williams Real Estate - Allentown
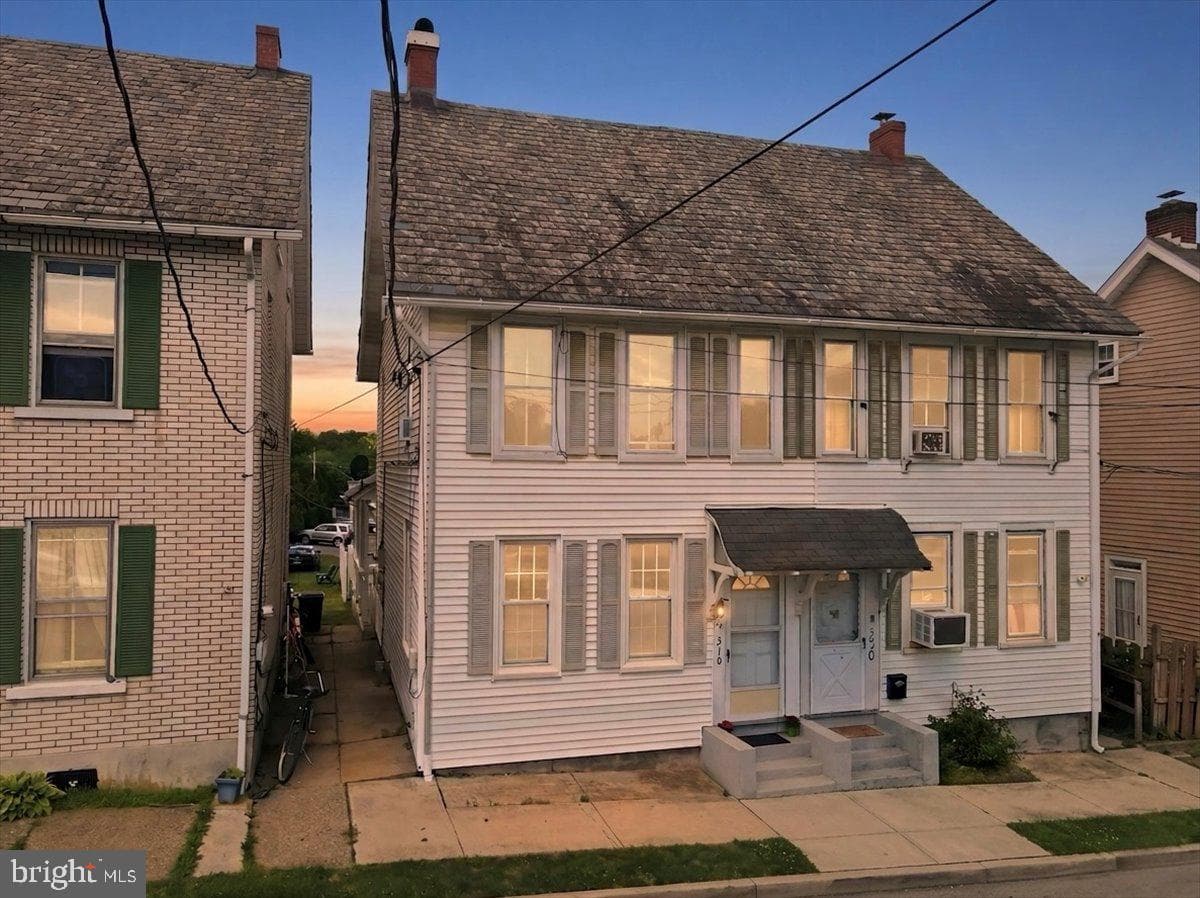
$279,900
318 Northampton St, Hellertown, PA 18055
Listed by Morganelli Properties LLC
$325,000
Price cut: was $402,400
934 Detweiler Ave, Hellertown, PA 18055
Listed by Country Home Real Estate, Inc.

$4,950,000
1731 Red Hawk Way, Bethlehem, PA 18015
Listed by BHHS Fox & Roach - Center Valley
Saucon Valley scores 69.4 of 100 on the NookLocal Academic Index — #18 of 69 districts serving Bucks, Montgomery, Berks, and the Lehigh Valley. Components (official 2025 PDE data): PSSA proficiency 57% (state ~45%), Keystone proficiency 68%, graduation rate 97.2% (state 89.1%). The index measures outcomes, not school effectiveness in isolation.
The district levies 55.2055 mills (2025-26) on Northampton County's assessment base — an effective school tax of about 0.94% of market value at the current Common Level Ratio. With county and typical municipal millage, the total runs about 1.37% — roughly $6,152 per year on a $450,000 purchase. Exact bills vary by municipality (1.22%–1.51% across 2) and by the home's actual assessment.
NookLocal-covered towns served by Saucon Valley: Hellertown, Hellertown Borough, Lower Saucon Township. The taxing municipalities are Lower Saucon Township, Hellertown Borough. A specific home's district is shown on every NookLocal listing.
Academically: Saucon Valley 69.4 vs. Nazareth Area 70.3 on the Academic Index. On taxes: 1.37% vs. 1.40% of home value per year — about $6,152 vs. $6,303 on a $450,000 purchase. Full comparison on the school district value matrix.
85.4% of Saucon Valley students are regularly present — enrolled and attending at least 90% of school days — versus 79.6% statewide (Future Ready PA Index, 2024-25).
17.8% of students receive special-education services (Pennsylvania average 20.3%), with about 286 students per school counselor and 1,000 per school psychologist. The Family & student support section above has the full breakdown.
Rather than a single safety score, NookLocal shows official district figures. Regular attendance is 85.4% (state 79.6%). These figures describe the district, not individual schools, and reported bullying is widely undercounted — see the Family & student support section.
Free email digest
New school budgets and the new Common Level Ratio land July 1 — every district's true rate moves. We send the re-rank, plus weekly new listings and price cuts.
Double opt-in. We only email you after you confirm. Unsubscribe any time. See our Privacy Policy.
Academic data: PA Department of Education district-level files (2024-25). Tax data: county assessment offices and STEB. Estimates only — verify with the district and county before transacting. Full methodology on the value matrix.
Why NookLocal
NookLocal was designed for people like you, looking to move to or within the area. Our local knowledge, data, and important local updates are what differentiate us from the big sites like Zillow, Trulia, Realtor.com, and more.
A real consult, then a hand-picked local agent or lender matched to you, not whoever paid for your ZIP. Underperformers get dropped.
Get matchedMost families pick the district before the house. We score every district on academics against its true tax cost, so you can find the best value, then search every home inside the boundary.
Search by districtPennsylvania taxes swing hard from town to town. We show real millage, the Common Level Ratio, and a calculator, so you know the yearly bill before you make an offer.
Try the calculatorThe big national sites don't show neighborhood safety data. We present clear, factual county numbers drawn from public FBI and Pennsylvania sources.
See the dataNot a single 1 to 10 score. Explore 450+ individual school pages and a district value report that scores academics against what each town actually costs.
See the rankingsWe cover five eastern-PA counties properly: Bucks, Montgomery, Lehigh, Northampton, and Berks, by people who actually live here.
Explore the areas