Local Data · Delaware County
Top 5 School Districts in Delaware County (Based on value)
Comparing school district quality with data has always been a difficult task. While there is no definitive science, NookLocal developed a methodology to capture what we deem to be the best value school districts in Delaware County, PA. This is based on comparing academic rankings relative to taxes paid to live in a particular district. Below are the results.
Two very different tax bills and school quality
Academics: Pennsylvania Department of Education, 2025 PSSA and Keystone files and SY 2024-25 cohort graduation rates. Taxes: 2026 county and municipal millage, 2025-26 school millage, STEB 2025 Common Level Ratio. Median sale prices: closed sales over the trailing 12 months, through 2026-07-10. School budgets and a new CLR land each July, and this ranking moves then.
Delaware County, PA has 15 school districts, and we ranked all 15 by value: measured academics per tax dollar. The value score per district measures each district's Academic Index by its total property-tax rate as a share of what a home costs today.
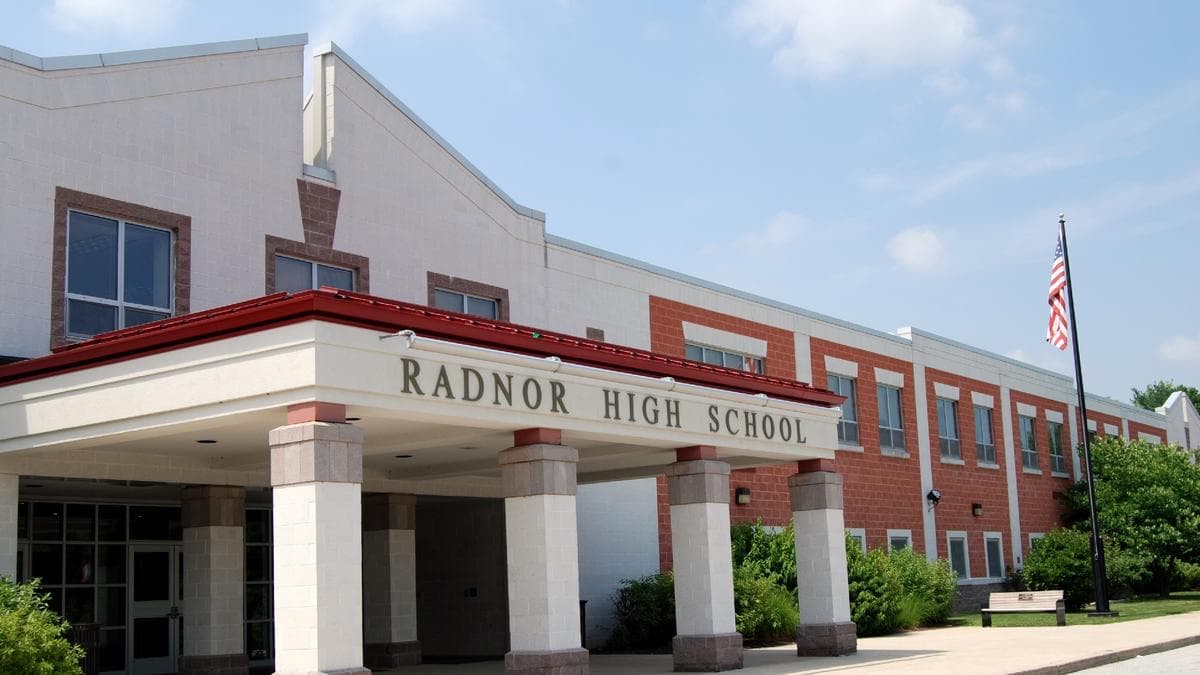
Radnor Township School District
The best value in Delaware County. Radnor ranks #2 academically of the 112 districts we score, behind only Lower Merion, and pairs it with the county's third-lowest tax rate. Homes sell around $1,150,000, the county's most expensive by a wide margin.
- 1.26%
- Typical tax
- $5,684
- /yr on $450,000
- $1,150,000
- Median sale, 12 mo (289 sales)
Towns: Radnor Township
See homes for sale in this districtRose Tree Media School District
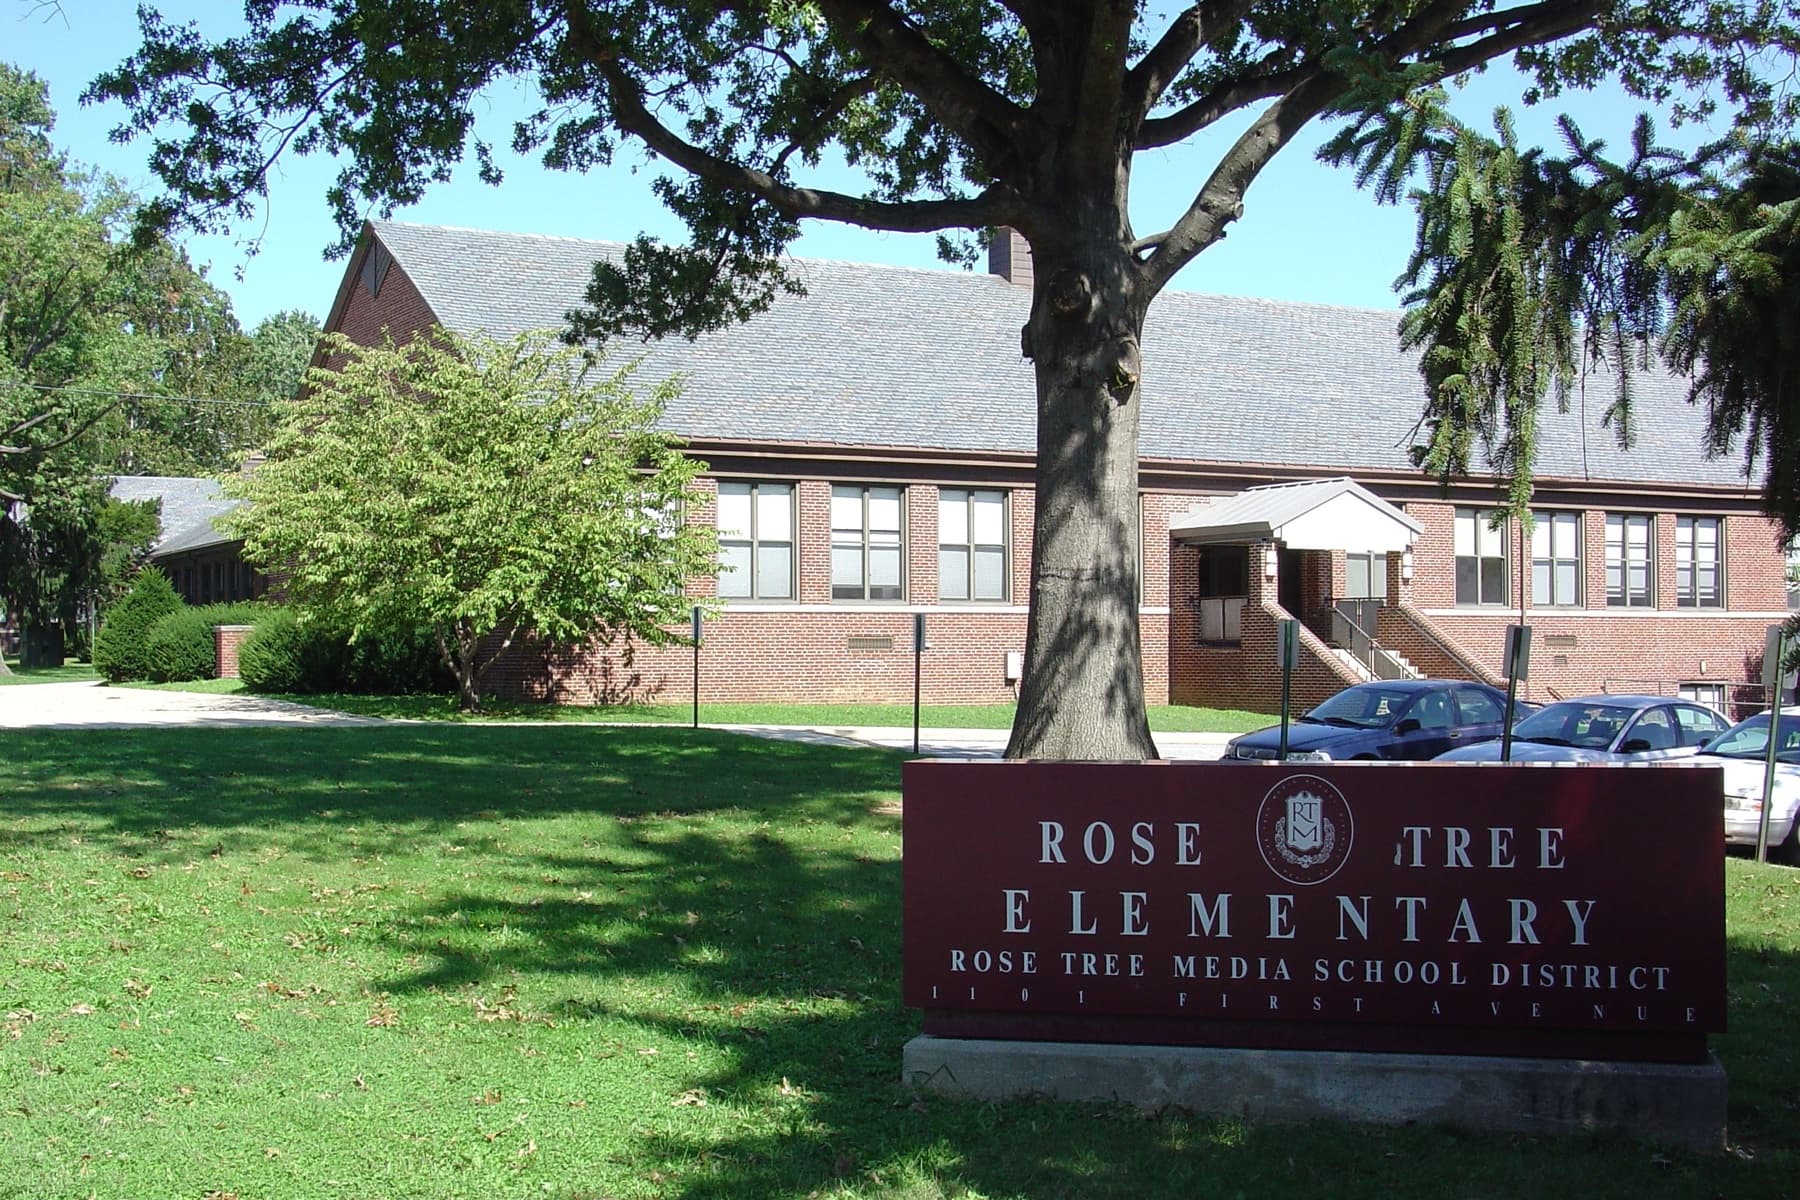
Nearly the winner, at little more than half the price. Rose Tree Media ranks #7 academically in the region, carries the county's second-lowest tax rate, and its homes sell around $630,000 against Radnor's $1,150,000. It serves Media, Middletown, Upper Providence, and Edgmont.
- 1.21%
- Typical tax
- $5,423
- /yr on $450,000
- $630,000
- Median sale, 12 mo (373 sales)
Towns: Edgmont Township, Media Borough, Middletown Township, Upper Providence Township
See homes for sale in this districtMarple Newtown School District
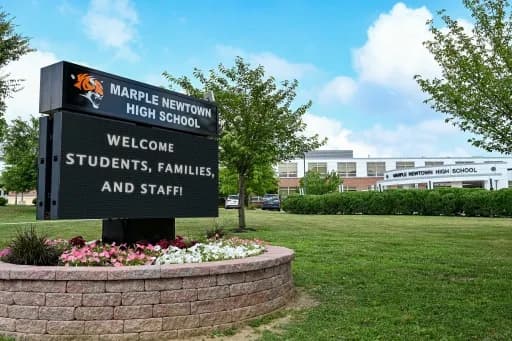
The lowest tax rate in the county. Marple Newtown earns this spot on its 1.07% total rate: academics sit mid-pack for the county, and no other district costs less on a $450,000 home, about $4,809 a year. It serves Marple and Newtown Townships.
- 1.07%
- Typical tax
- $4,809
- /yr on $450,000
- $672,500
- Median sale, 12 mo (406 sales)
Towns: Marple Township, Newtown Township
See homes for sale in this districtGarnet Valley School District
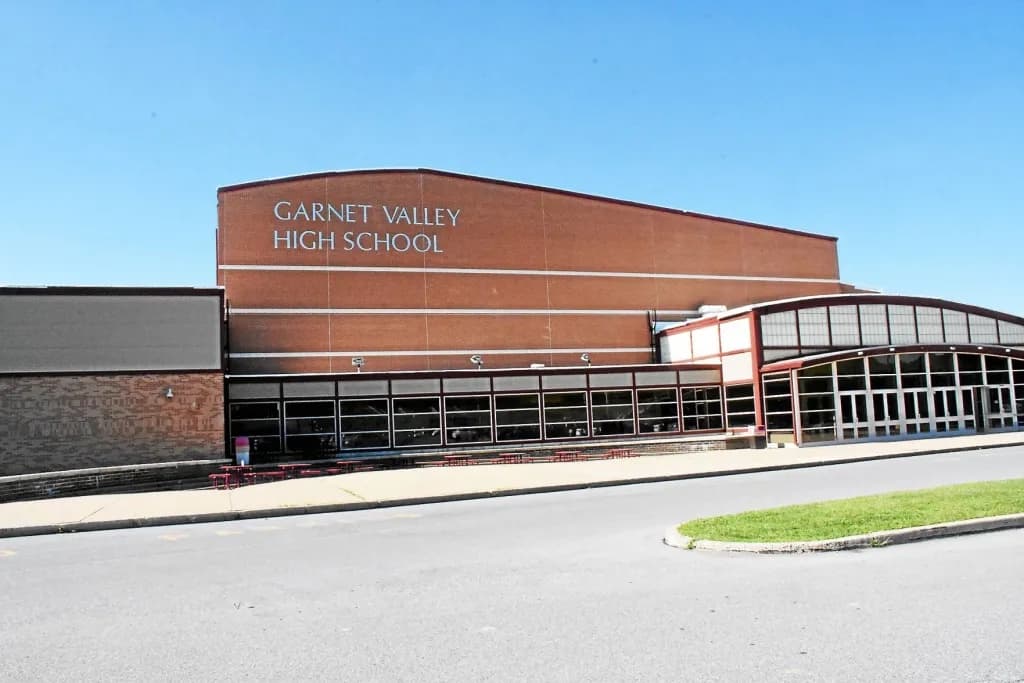
Top-ten academics at a moderate rate. Garnet Valley ranks #10 academically in the region, and its 1.39% rate is the fifth-lowest in a county where seven districts run above 2%. It serves Concord, Bethel, and Chester Heights.
- 1.39%
- Typical tax
- $6,257
- /yr on $450,000
- $585,000
- Median sale, 12 mo (383 sales)
Towns: Bethel Township, Chester Heights Borough, Concord Township
See homes for sale in this districtHaverford Township School District
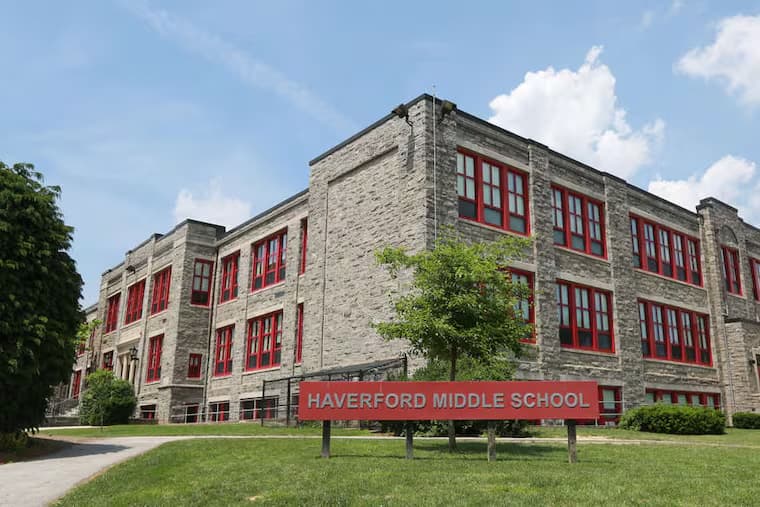
The region's #4 academics close the list. Haverford is the strongest school system on this list after Radnor, and its 1.58% rate is what holds it to fifth on value. It is also the busiest market in this top five, with more sales than any district above it.
- 1.58%
- Typical tax
- $7,119
- /yr on $450,000
- $550,000
- Median sale, 12 mo (521 sales)
Towns: Haverford Township
See homes for sale in this district
Looking for a home in Delaware County?
Search homes for sale in Delaware CountyThe other 10 districts
Six of the region's ten strongest academic districts are in Delaware County, and four of them made this list. High tax rates keep the other two out: Springfield, the region's #3 academics, carries a 1.78% rate, and Wallingford-Swarthmore, #9, is above 2.1%. Seven of the county's 15 districts run above 2% of home value, and William Penn's 2.66% rate against weak academics gives it the lowest value score of all 112 districts we rank. A $450,000 home there carries roughly $12,000 a year in property taxes, two and a half times the same home in Marple Newtown. Chester-Upland is different: its rate is among the county's lowest, but the region's weakest academics hold it near the bottom.
- 6Springfieldindex 83.1 · 1.78% · $8,019/yr
- 7Wallingford-Swarthmoreindex 80.2 · 2.17% · $9,746/yr
- 8Penn-Delcoindex 59.2 · 1.60% · $7,215/yr
- 9Interboroindex 52.8 · 2.05% · $9,220/yr
- 10Ridleyindex 55.4 · 2.19% · $9,850/yr
- 11Chichesterindex 51.1 · 2.41% · $10,844/yr
- 12Chester-Uplandindex 22.9 · 1.36% · $6,098/yr
- 13Upper Darbyindex 36.3 · 2.36% · $10,605/yr
- 14Southeast Delcoindex 36.3 · 2.54% · $11,446/yr
- 15William Pennindex 33.6 · 2.66% · $11,953/yr
How this ranking works
Value here is a ratio: the NookLocal Academic Index (0-100, built only from official state results: 40% PSSA grades 3-8, 40% Keystone grade 11, 20% four-year graduation rate, "All Students" group) divided by the district's typical total property-tax rate as a share of a home's real market price (county plus median municipal plus school millage, converted by the county's Common Level Ratio). More measured academics per tax dollar ranks higher. Dollar figures use a $450,000 purchase. Two limits: the index measures student outcomes, not school effectiveness, and outcomes track demographics as much as anything a school controls; and rates vary by municipality within a district, so open a district for its full range. This is context for choosing a district to shop in. It is not a rating of any individual school, teacher, home, or street.
Every component is public: the School District Value Matrix has all 112 scored districts region-wide, the Delaware County academic ranking sorts on scores alone, and the Delaware County property-tax guide shows the full tax math by district and municipality.
Need an agent who gets you?
Our co-founder Carmen does a 1-on-1 needs analysis with you, then hand-picks a vetted local agent or lender. Free, no obligation. If you work with a partner we introduce, NookLocal may earn a referral fee from their broker.
Common questions
What is the best value school district in Delaware County, PA?
By academics per tax dollar, Radnor Township: an Academic Index of 86.3 at a typical total property-tax rate of about 1.26% of home value, roughly $5,684 a year on a $450,000 purchase. Value is a ratio, though, not a budget: the ranked list above pairs each district with its 12-month median sale price so you can see where the ratio meets what homes actually sell for.
How is "value" calculated in this ranking?
Each district's NookLocal Academic Index (0-100, from official PSSA, Keystone, and graduation results) is divided by its typical total effective property-tax rate (county + median municipal + school millage, multiplied by the county's Common Level Ratio, expressed as a percent of market price). The result is index points per 1% of home value paid in tax each year. Every input is published on the School District Value Matrix so you can re-weight it yourself. It measures outcomes, not school effectiveness.
Which Delaware County school district has the lowest property taxes?
Marple Newtown, at a typical total of about 1.07% of home value, roughly $4,809 a year on a $450,000 purchase, with Rose Tree Media next at about 1.21%. Rates vary by municipality inside every district; the Delaware County property-tax guide lists each one.
Is Wallingford-Swarthmore worth its taxes?
Wallingford-Swarthmore ranks #9 academically of the 112 districts we score, but its total rate is 2.17% of home value, roughly $9,746 a year on a $450,000 home. On measured academics per tax dollar, Rose Tree Media comes out well ahead at a little more than half the tax bill; whether Wallingford-Swarthmore is worth the premium depends on the family.
Looking for a home in Delaware County?
Search homes for sale in Delaware CountyFree Newsletter
The NookLocal Digest
We work hard to only send quality information in our newsletter. Sign up!
Unsubscribe any time. See our Privacy Policy.